Free Access
Fig. 2
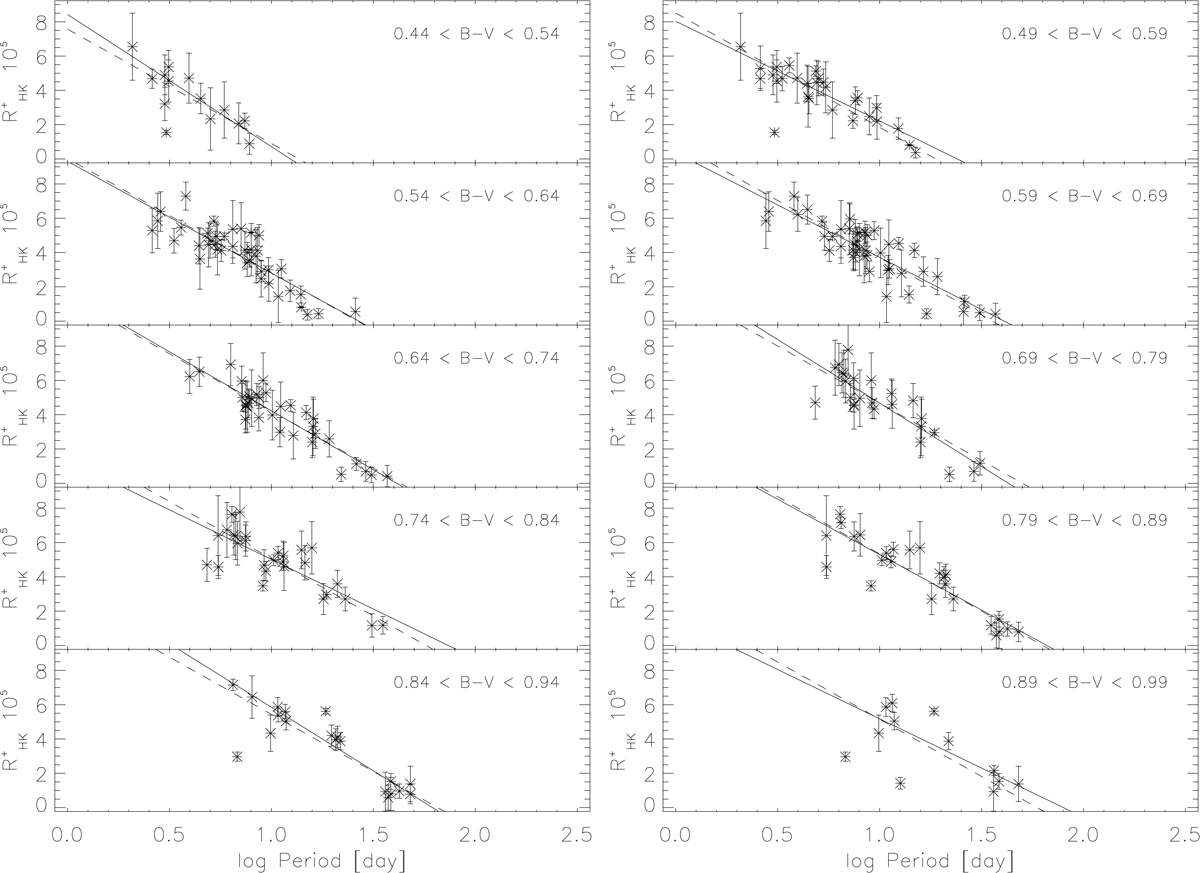
Pure activity flux excess index ![]() values are plotted over the logarithm of the rotation periods in adjacent B–V intervals. The solid lines show the linear fit to each such data set. The dashed lines depict the linear fit with the mean slope that is used to estimate the convective turnover time.
values are plotted over the logarithm of the rotation periods in adjacent B–V intervals. The solid lines show the linear fit to each such data set. The dashed lines depict the linear fit with the mean slope that is used to estimate the convective turnover time.
Current usage metrics show cumulative count of Article Views (full-text article views including HTML views, PDF and ePub downloads, according to the available data) and Abstracts Views on Vision4Press platform.
Data correspond to usage on the plateform after 2015. The current usage metrics is available 48-96 hours after online publication and is updated daily on week days.
Initial download of the metrics may take a while.