Fig. 4
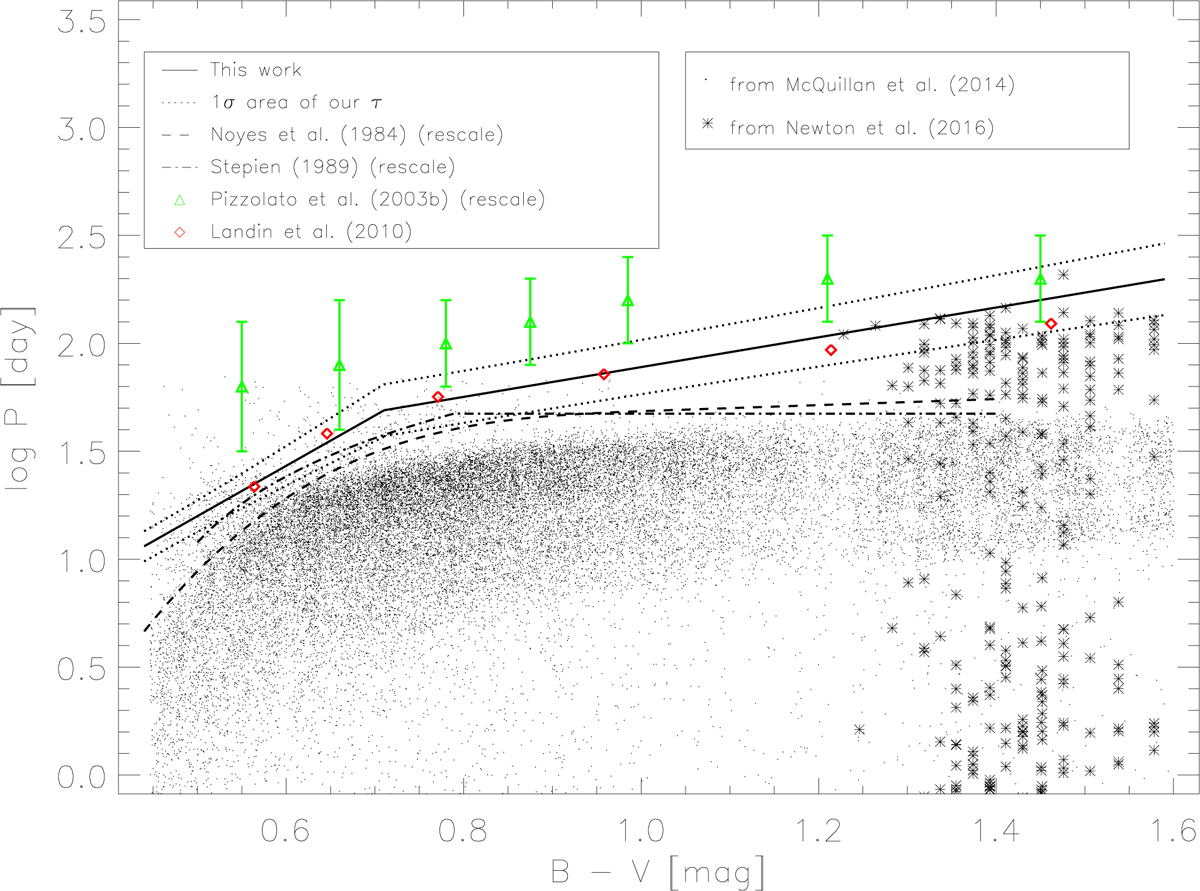
Logarithm of the rotation periods vs. B–V from the catalogue by McQuillan et al. (2014b) and Newton et al. (2016b). Furthermore, our empirical convective turnover time calculated with Eqs. (11) and (12) is plotted as a solid line. The dotted line is labelled as the 1σ error area of convective turnover time. The rescaled relations by Noyes et al. (1984) and Stepien (1989) are plotted as dashed and dashed dotted line, respectively. The green triangle points are labelled as the values of the empirical convective turnover time by Pizzolato et al. (2003) and the values by Landin et al. (2010) are labelled with red diamonds.
Current usage metrics show cumulative count of Article Views (full-text article views including HTML views, PDF and ePub downloads, according to the available data) and Abstracts Views on Vision4Press platform.
Data correspond to usage on the plateform after 2015. The current usage metrics is available 48-96 hours after online publication and is updated daily on week days.
Initial download of the metrics may take a while.