Free Access
Fig. 7
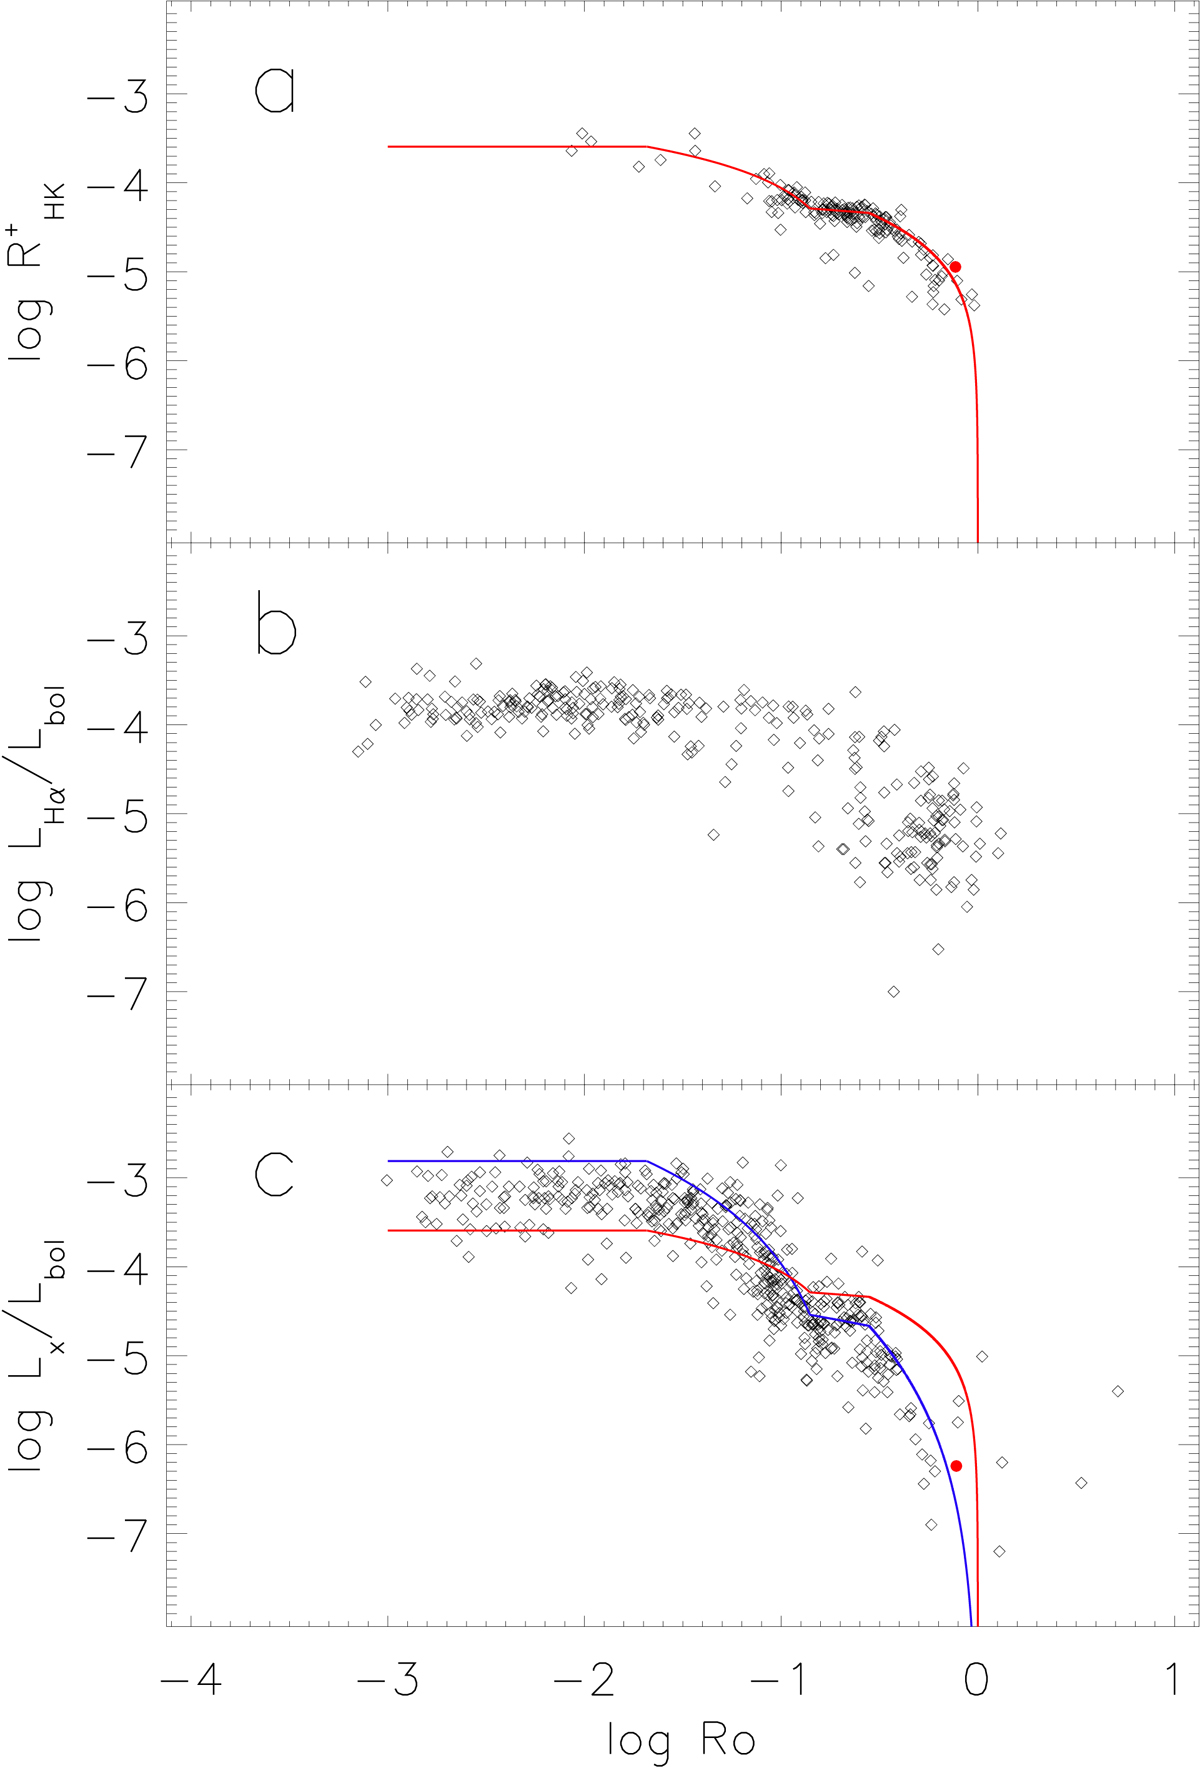
Log ![]() , log LHα/Lbol, and log LX/Lbol vs. Rossby number are shown. The red line depicted our flux trend for
, log LHα/Lbol, and log LX/Lbol vs. Rossby number are shown. The red line depicted our flux trend for ![]() vs. Rossby number and the red dot indicates the Sun. The blue line indicates the
vs. Rossby number and the red dot indicates the Sun. The blue line indicates the ![]() trend transformed into the log LX/Lbol scale with Eq. (3).
trend transformed into the log LX/Lbol scale with Eq. (3).
Current usage metrics show cumulative count of Article Views (full-text article views including HTML views, PDF and ePub downloads, according to the available data) and Abstracts Views on Vision4Press platform.
Data correspond to usage on the plateform after 2015. The current usage metrics is available 48-96 hours after online publication and is updated daily on week days.
Initial download of the metrics may take a while.