Fig. 6
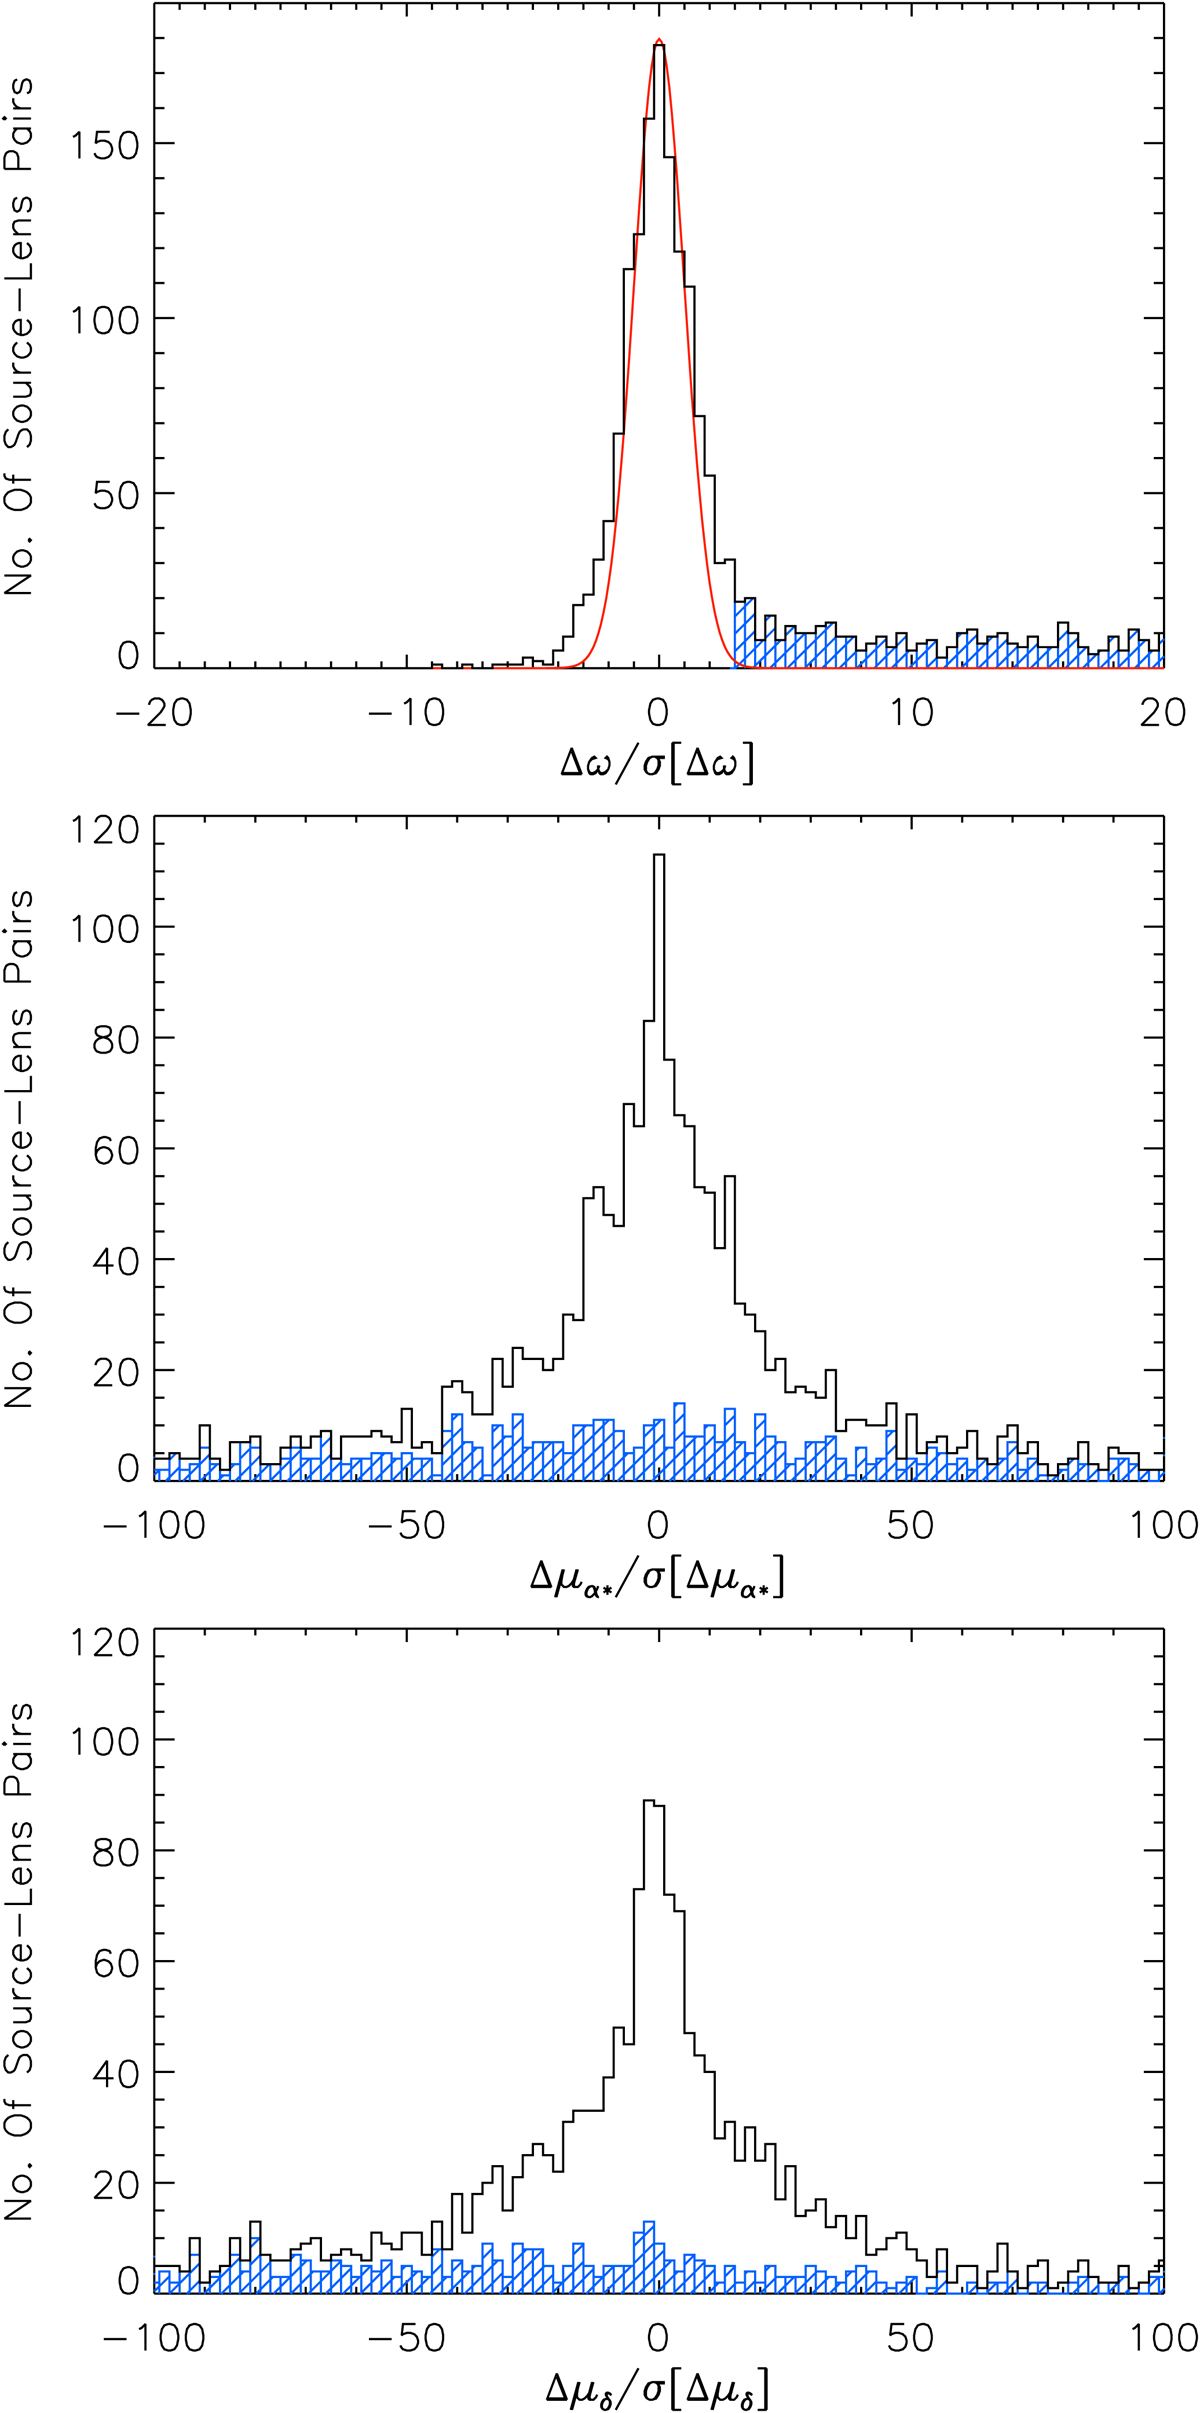
Histograms of Δϖ/σ[Δϖ] (top panel), Δμα*/σ[Δμα*] (middle panel) and Δμδ/σ[Δμδ] (bottom panel) for 2882 source-lens pairs (black histograms). In the top panel, the red curve is a Gaussian with zero mean and standard deviation of unity, scaled to match the histogram of Δϖ/σ[Δϖ]. In each panel, the blue histogram with striped bars is for the source-lens pairs satisfying Δϖ/σ[Δϖ] > 3.
Current usage metrics show cumulative count of Article Views (full-text article views including HTML views, PDF and ePub downloads, according to the available data) and Abstracts Views on Vision4Press platform.
Data correspond to usage on the plateform after 2015. The current usage metrics is available 48-96 hours after online publication and is updated daily on week days.
Initial download of the metrics may take a while.