Fig. 8.
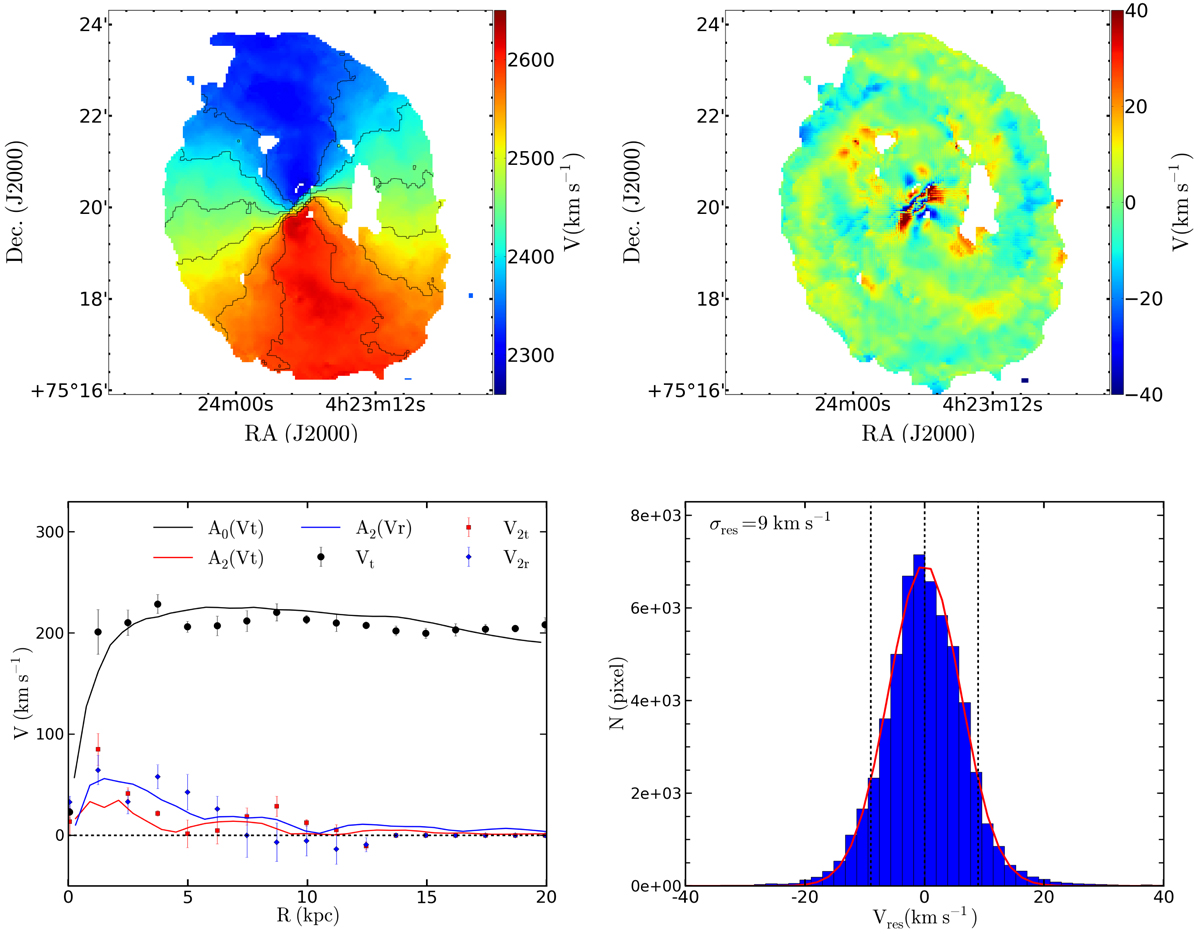
DiskFit results for NGC 1530. The moment1 map is on the top left panel and the residual map is displayed on the top right panel. A histogram of the residuals is presented on the bottom right panel and a comparison between the DiskFit velocities Vt, V2t and V2r with the amplitude of the m = 0 and m = 2 Fourier mode A0 and A2 on the left panel. The black contours are spaced by 50 km s−1.
Current usage metrics show cumulative count of Article Views (full-text article views including HTML views, PDF and ePub downloads, according to the available data) and Abstracts Views on Vision4Press platform.
Data correspond to usage on the plateform after 2015. The current usage metrics is available 48-96 hours after online publication and is updated daily on week days.
Initial download of the metrics may take a while.