Fig. 1.
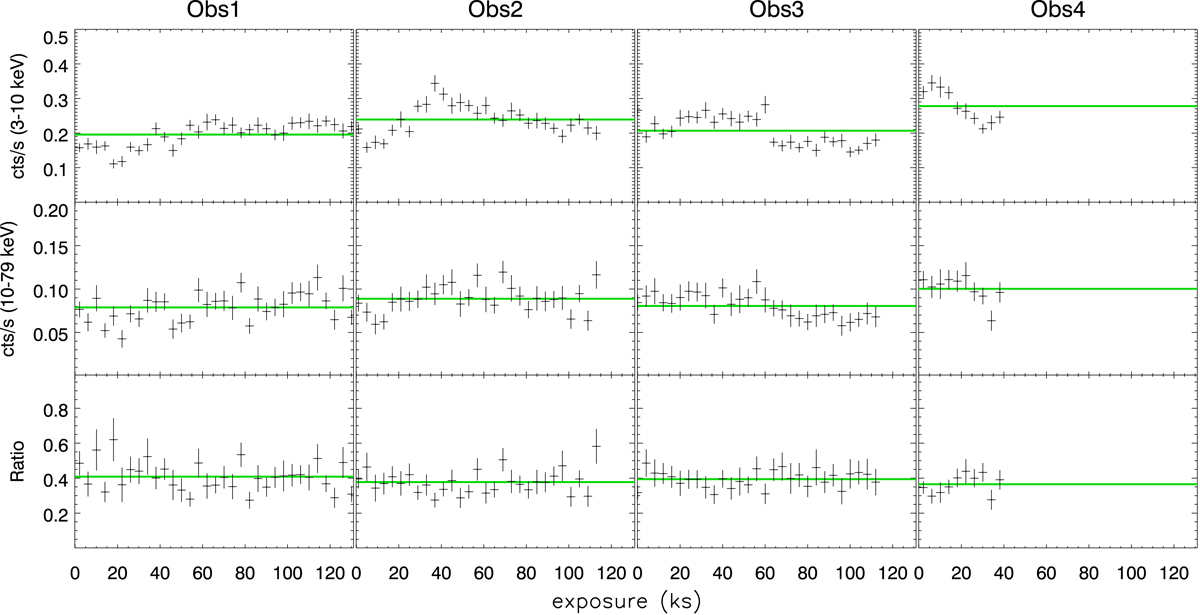
Top and middle panels: coadded FPMA and FPMB light curves shown in the 3–10 keV and 10–79 keV energy bands, respectively. For the various pointings, the ratios between the 10–79 keV light curves and those computed in the 3–10 keV band are shown. The adopted time binning is 4 ks for all the observations. Solid green lines account for the average count rates within each pointing. The exposures in the graph are twice as long as those reported in Table 1 because half of the NuSTAR time is cut due to Earth occultations.
Current usage metrics show cumulative count of Article Views (full-text article views including HTML views, PDF and ePub downloads, according to the available data) and Abstracts Views on Vision4Press platform.
Data correspond to usage on the plateform after 2015. The current usage metrics is available 48-96 hours after online publication and is updated daily on week days.
Initial download of the metrics may take a while.