Free Access
Fig. 1.
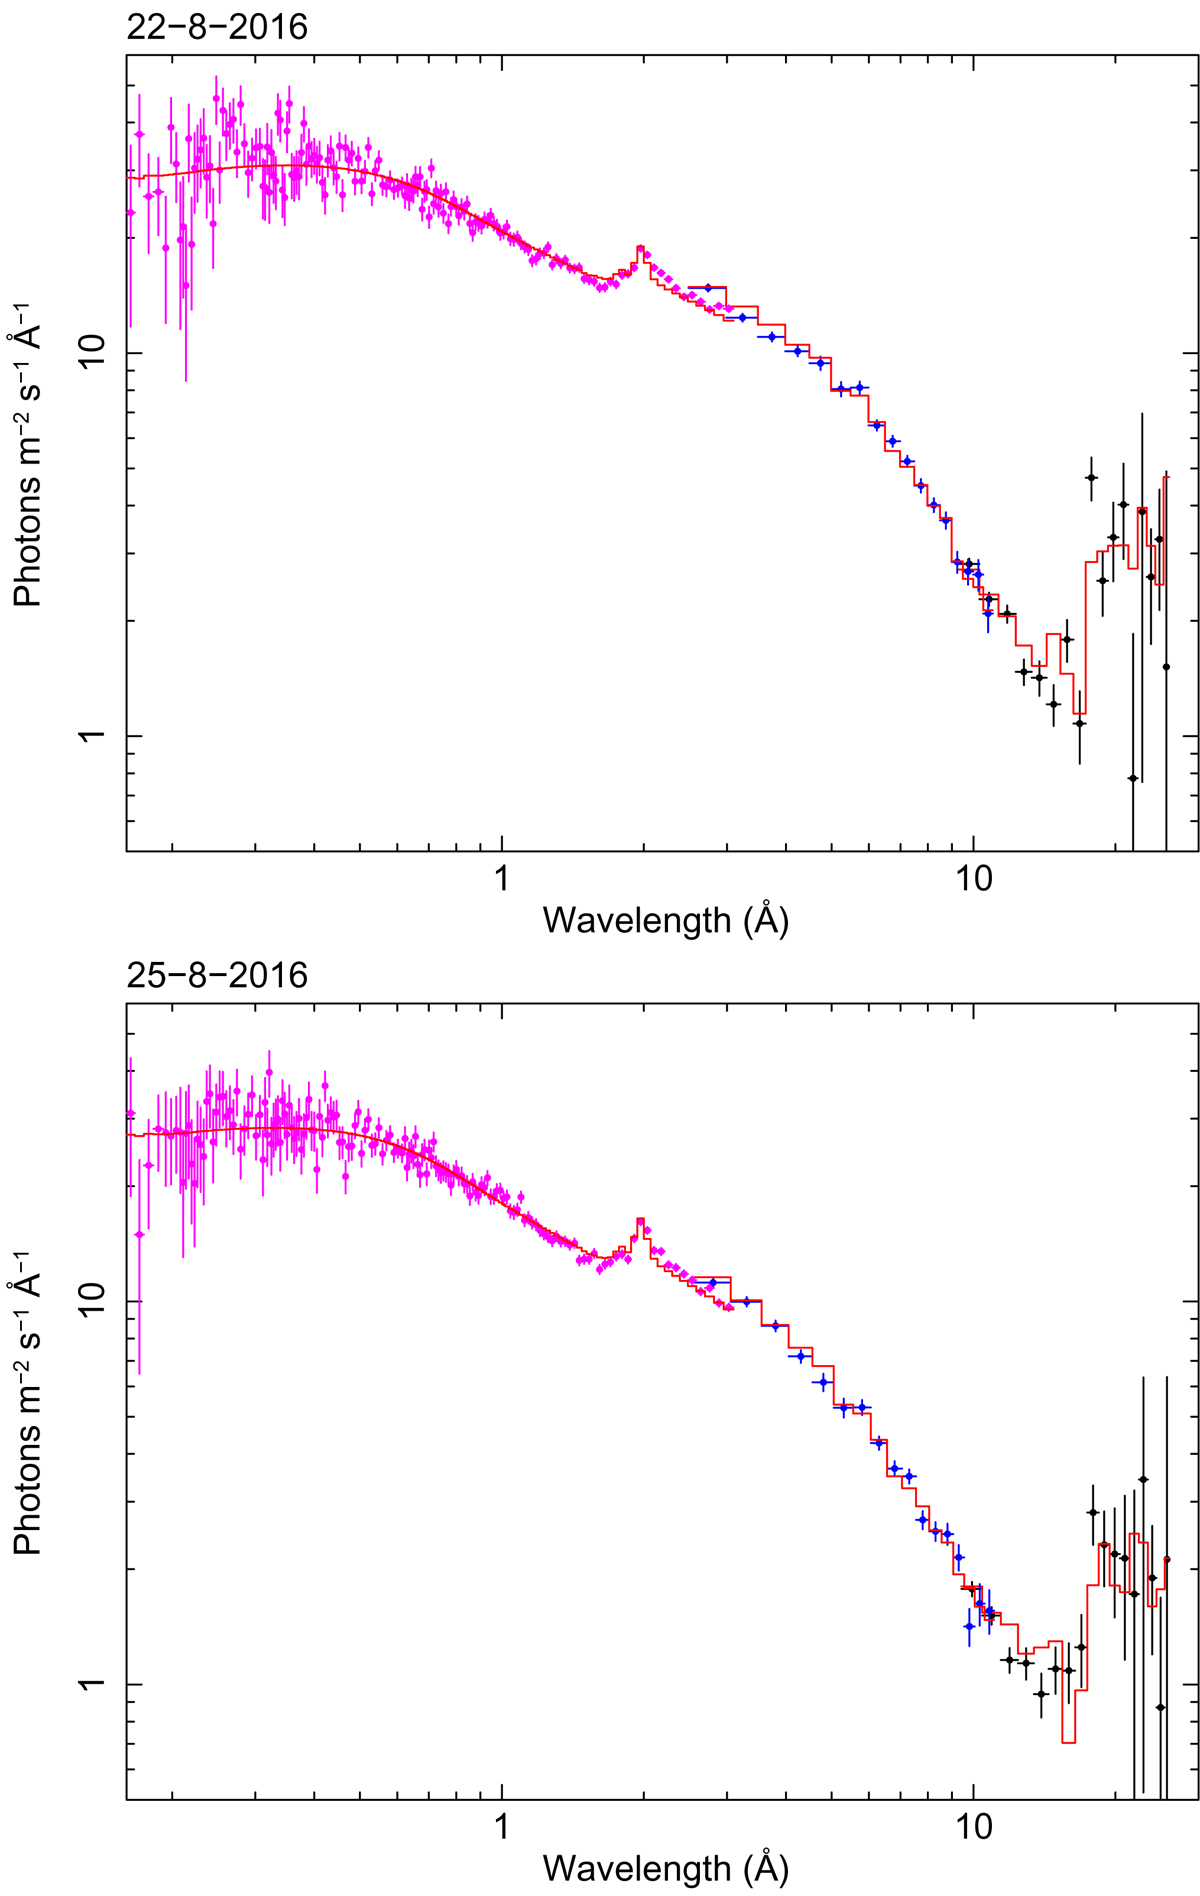
Fluxed spectra of NGC 3783 on August 22 and August 25, 2016, using the model described in the text. Red curve: best-fit model; purple crosses: NuSTAR data; blue and black crosses: HEG and MEG data, both rebinned by a factor of 100 for display purposes.
Current usage metrics show cumulative count of Article Views (full-text article views including HTML views, PDF and ePub downloads, according to the available data) and Abstracts Views on Vision4Press platform.
Data correspond to usage on the plateform after 2015. The current usage metrics is available 48-96 hours after online publication and is updated daily on week days.
Initial download of the metrics may take a while.