Free Access
Fig. 3.
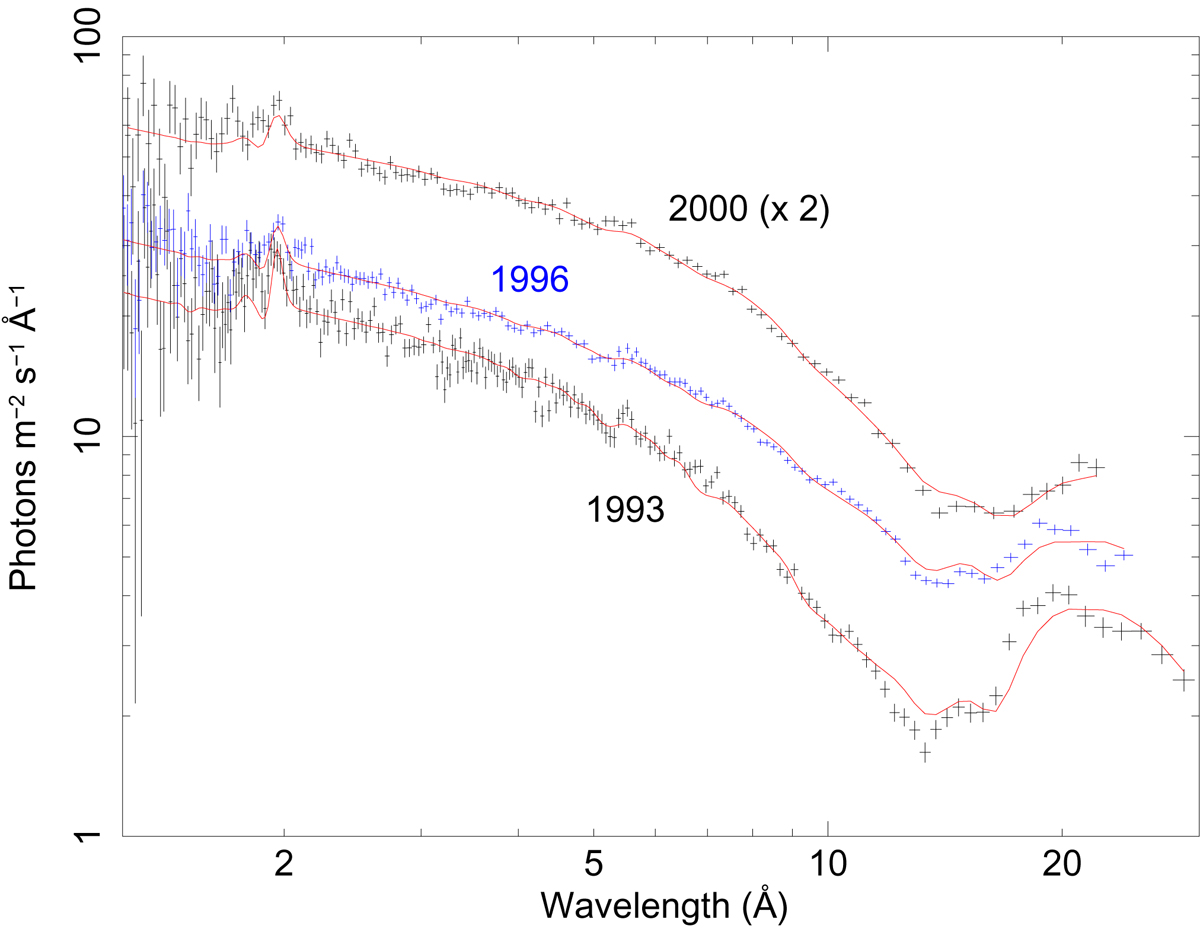
ASCA SIS spectra taken in 1993 (black crosses, lower spectrum), 1996 (blue crosses, middle spectrum) and 2000 (black crosses, upper spectrum, for display purposes scaled by a factor of two), together with the best-fit models as shown by the red lines. See Sect. 3.2 for an explanation of the deviations at long wavelengths.
Current usage metrics show cumulative count of Article Views (full-text article views including HTML views, PDF and ePub downloads, according to the available data) and Abstracts Views on Vision4Press platform.
Data correspond to usage on the plateform after 2015. The current usage metrics is available 48-96 hours after online publication and is updated daily on week days.
Initial download of the metrics may take a while.