Fig. 4.
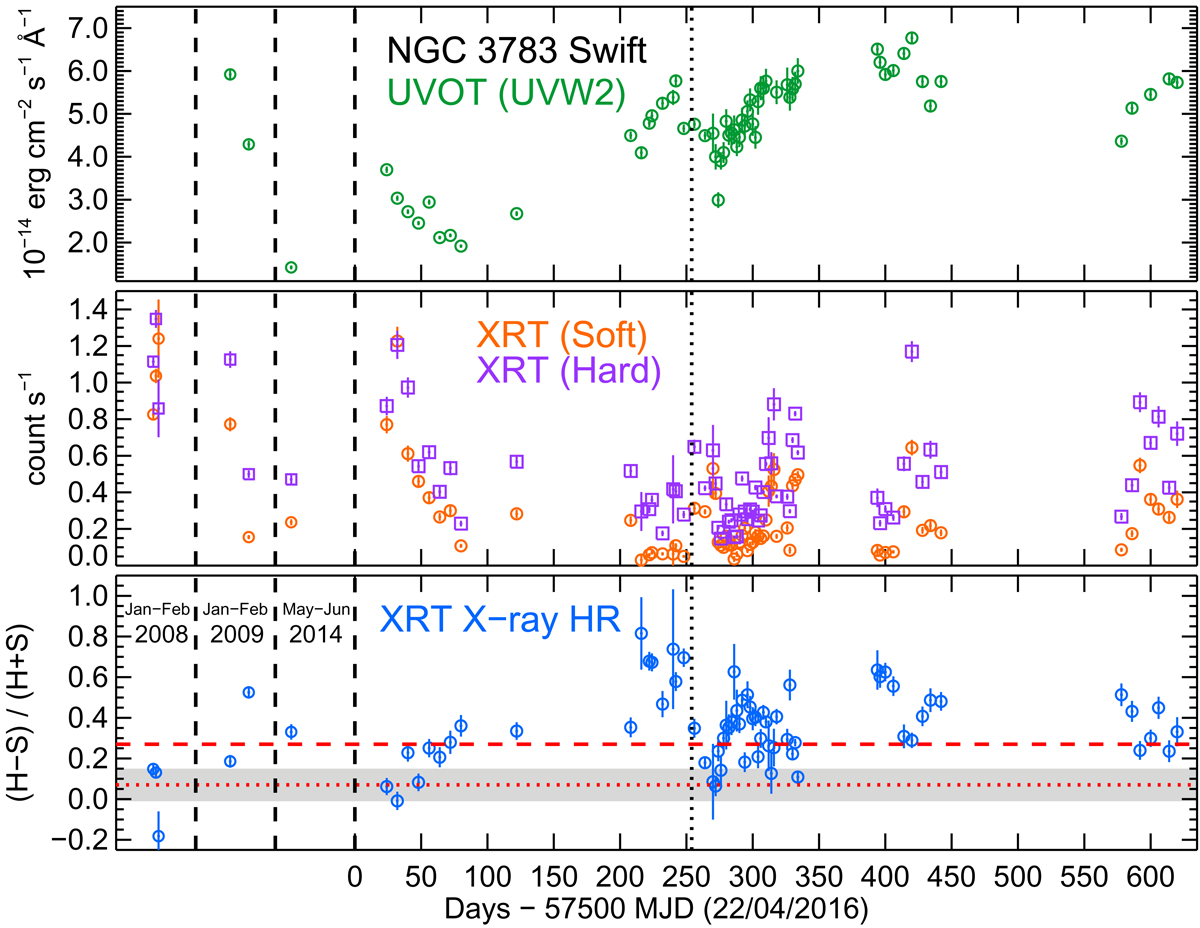
Swift light curves in different bands. The vertical dotted line indicates 1 January 2017. The data have been averaged over two days. The last datapoint was taken on January 3, 2018. Top panel: UVOT flux; middle panel: soft (0.3–1.5 keV) and hard (1.5–10 keV) X-ray count rate; bottom panel: hardness ratio R = (H − S )/(H + S ) with S and H the soft and hard X-ray count rates. Dotted horizontal line: average hardness without obscuration as described in the text; the grey area corresponds, with its typical variations, to variations in the continuum. Dashed horizontal line: hardness above which there is strong obscuration (see text).
Current usage metrics show cumulative count of Article Views (full-text article views including HTML views, PDF and ePub downloads, according to the available data) and Abstracts Views on Vision4Press platform.
Data correspond to usage on the plateform after 2015. The current usage metrics is available 48-96 hours after online publication and is updated daily on week days.
Initial download of the metrics may take a while.