Fig. 7.
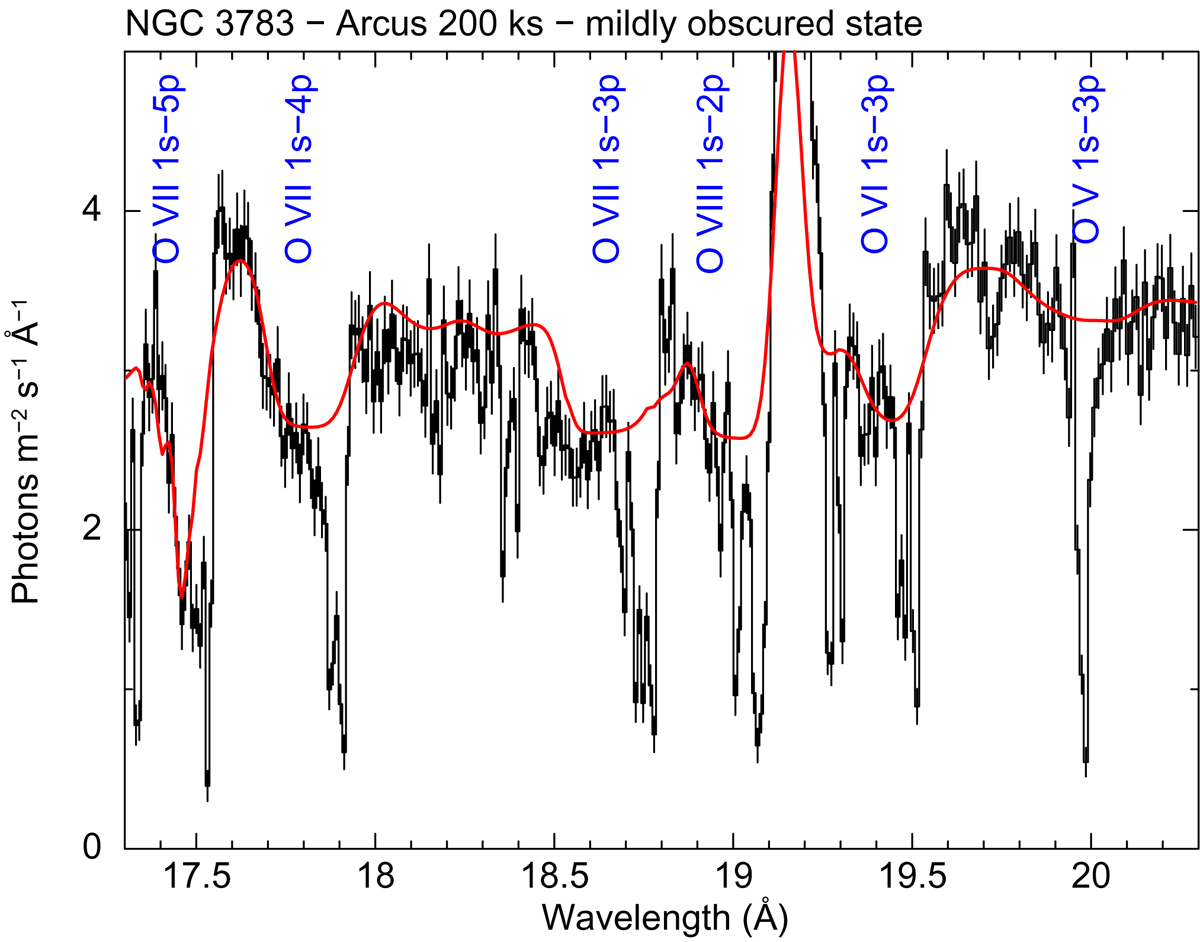
Part of a simulated spectrum for the Arcus mission for NGC 3783 with the same source parameters as it showed on 22 August 2016 (this paper). The simulated spectrum is shown as the black histogram with error bars. The red curve shows the obscured continuum that the warm absorber receives, scaled down by a factor of 3.3. The narrow O VIII Lyman alpha emission line at 19.15 Å is from a remote region and is cutoff in this plot. This figure shows that Arcus will be able to separate the narrow absorption lines of the warm absorber from the broad absorption lines from the obscurer.
Current usage metrics show cumulative count of Article Views (full-text article views including HTML views, PDF and ePub downloads, according to the available data) and Abstracts Views on Vision4Press platform.
Data correspond to usage on the plateform after 2015. The current usage metrics is available 48-96 hours after online publication and is updated daily on week days.
Initial download of the metrics may take a while.