Fig. 1.
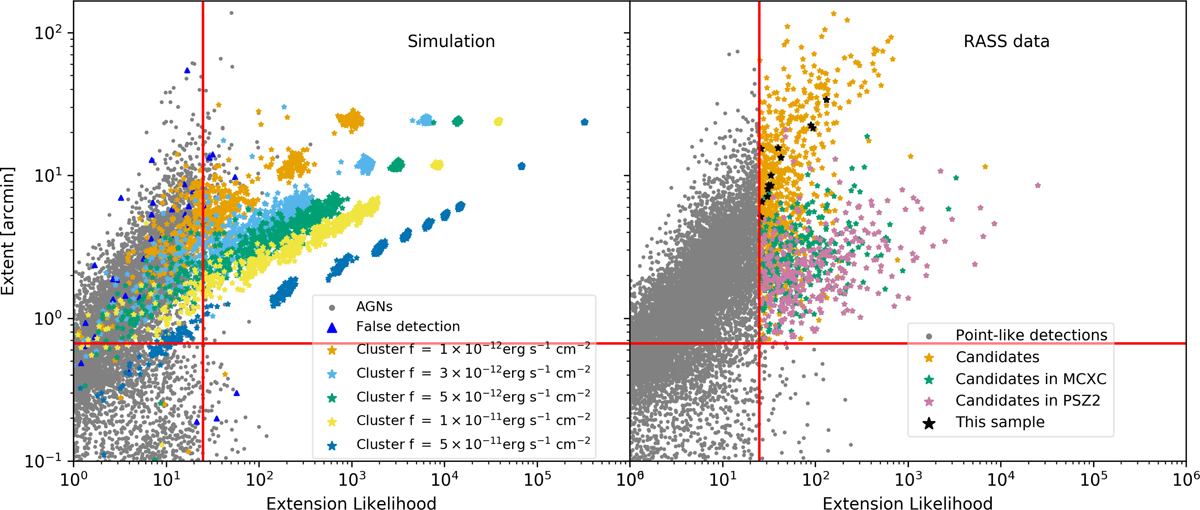
Selection criteria for extended sources. The selection is performed in the extension likelihood - extent plane. The red-solid lines define the optimal parameters obtained from simulations to characterize extended sources. Left: simulation results. Gray dots represent simulated AGNs, and blue triangles, false detections. Colored stars represent clusters with different input fluxes. Right: results from reprocessing RASS data. Gray dots stand for point-like detections and the star symbols for the cluster candidates. Green and pink stars show the candidates with identified counterparts in the MCXC and PSZ2 catalogs, respectively. The black stars represent the 13 groups of our pilot sample described in Table 3.
Current usage metrics show cumulative count of Article Views (full-text article views including HTML views, PDF and ePub downloads, according to the available data) and Abstracts Views on Vision4Press platform.
Data correspond to usage on the plateform after 2015. The current usage metrics is available 48-96 hours after online publication and is updated daily on week days.
Initial download of the metrics may take a while.