Free Access
Fig. 1
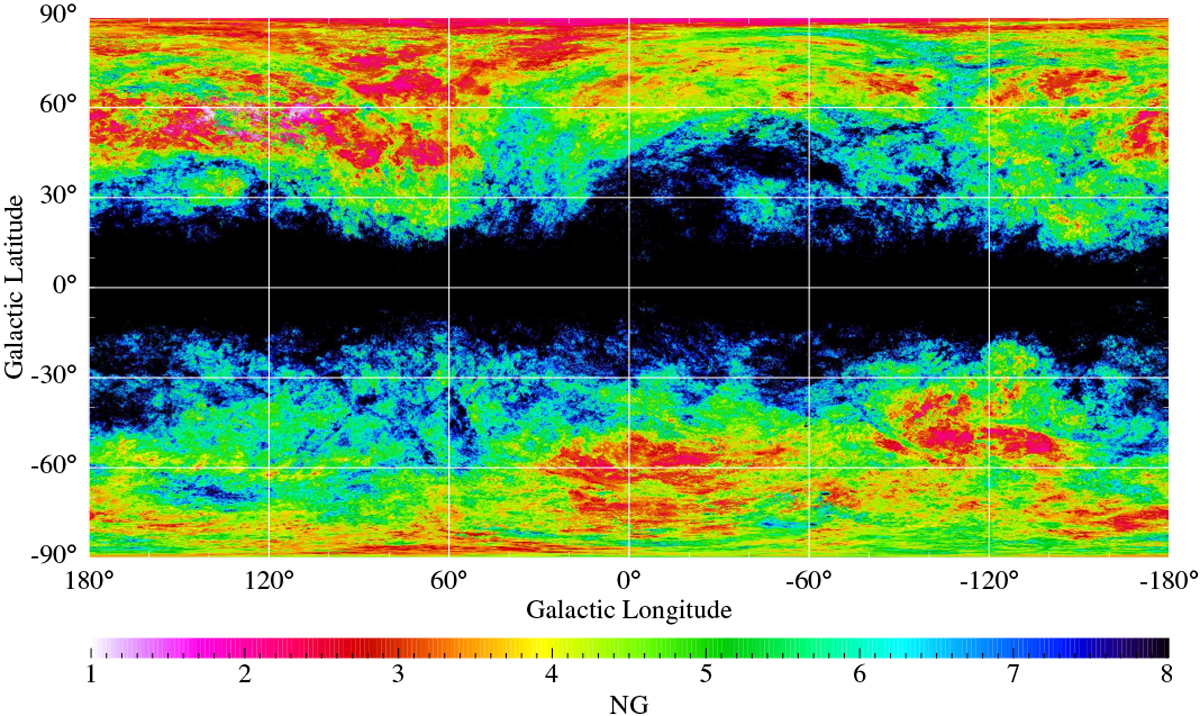
Sky positions of the 7 855 871 profiles with less than eight Gaussians in the central emission peak. The positions of the simplest profiles are marked by the reddest colors. Among the profiles with an equal number of Gaussians those with lower column density of the local H I are plotted with redder color.
Current usage metrics show cumulative count of Article Views (full-text article views including HTML views, PDF and ePub downloads, according to the available data) and Abstracts Views on Vision4Press platform.
Data correspond to usage on the plateform after 2015. The current usage metrics is available 48-96 hours after online publication and is updated daily on week days.
Initial download of the metrics may take a while.