Fig. 16
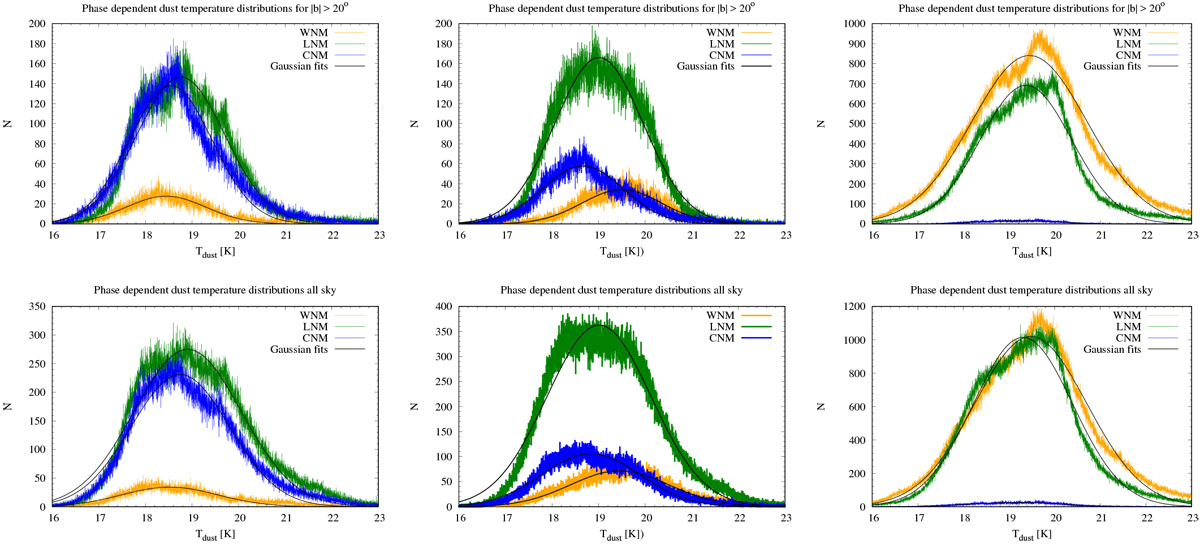
Frequency distribution for dust temperatures in selected regions on the sky. From left to right: CNM dominated, unconstrained, and WNM dominated according to Fig. 13. Top panel: data at |b| > 20° in the velocity range − 8 < vLSR < 8 km s−1 are used for fCNM > 2∕3 (blue), fLNM > 2∕3 (green), and fWNM > 2∕3 (yellow). Bottom panel: the same distribution for all-sky.
Current usage metrics show cumulative count of Article Views (full-text article views including HTML views, PDF and ePub downloads, according to the available data) and Abstracts Views on Vision4Press platform.
Data correspond to usage on the plateform after 2015. The current usage metrics is available 48-96 hours after online publication and is updated daily on week days.
Initial download of the metrics may take a while.