Free Access
Fig. 18
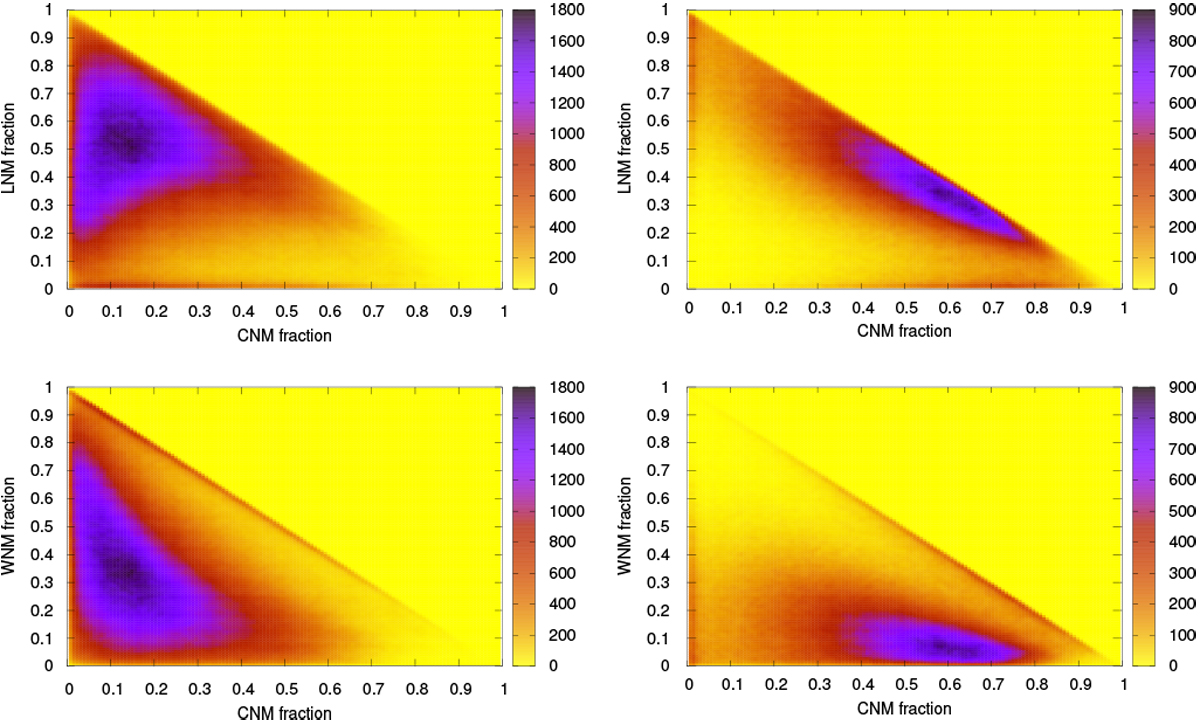
All sky 2D distribution functions, showing how frequent phase fractions of different phases are related to each other for |b| > 20° in the velocity range − 8 < vLSR < 8 km s−1. Top for CNM and LNM and bottom for CNM and WNM. Left panel: unconstrained H I data; right panel: filamentary H I structures only.
Current usage metrics show cumulative count of Article Views (full-text article views including HTML views, PDF and ePub downloads, according to the available data) and Abstracts Views on Vision4Press platform.
Data correspond to usage on the plateform after 2015. The current usage metrics is available 48-96 hours after online publication and is updated daily on week days.
Initial download of the metrics may take a while.