Fig. A.1
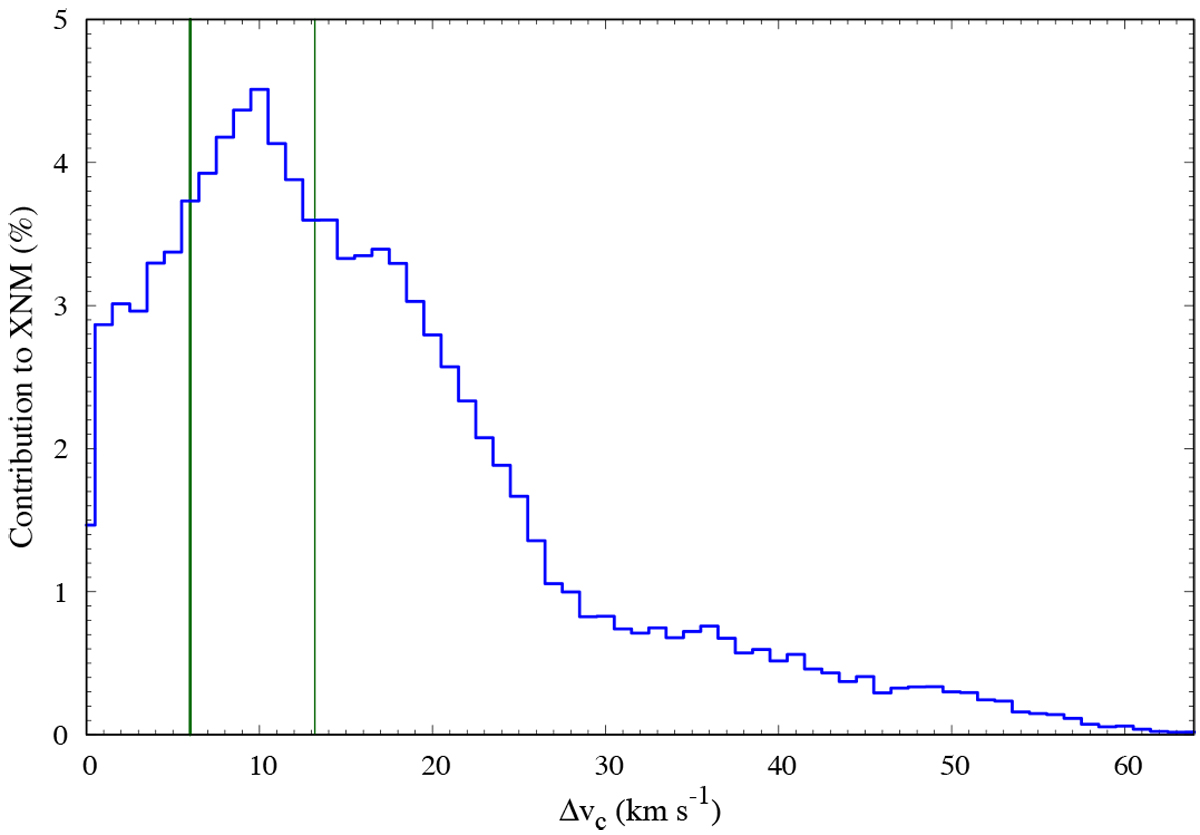
Fractions of the total column density of the XNM from profiles with NG = 2 as a functionof the velocity difference Δvc between thecenters of their Gaussian components. The shifts up to the thick green line are likely explainable with the uncertainties in the Gaussian decomposition and the thin green line marks the median of the distribution.
Current usage metrics show cumulative count of Article Views (full-text article views including HTML views, PDF and ePub downloads, according to the available data) and Abstracts Views on Vision4Press platform.
Data correspond to usage on the plateform after 2015. The current usage metrics is available 48-96 hours after online publication and is updated daily on week days.
Initial download of the metrics may take a while.