Fig. A.2
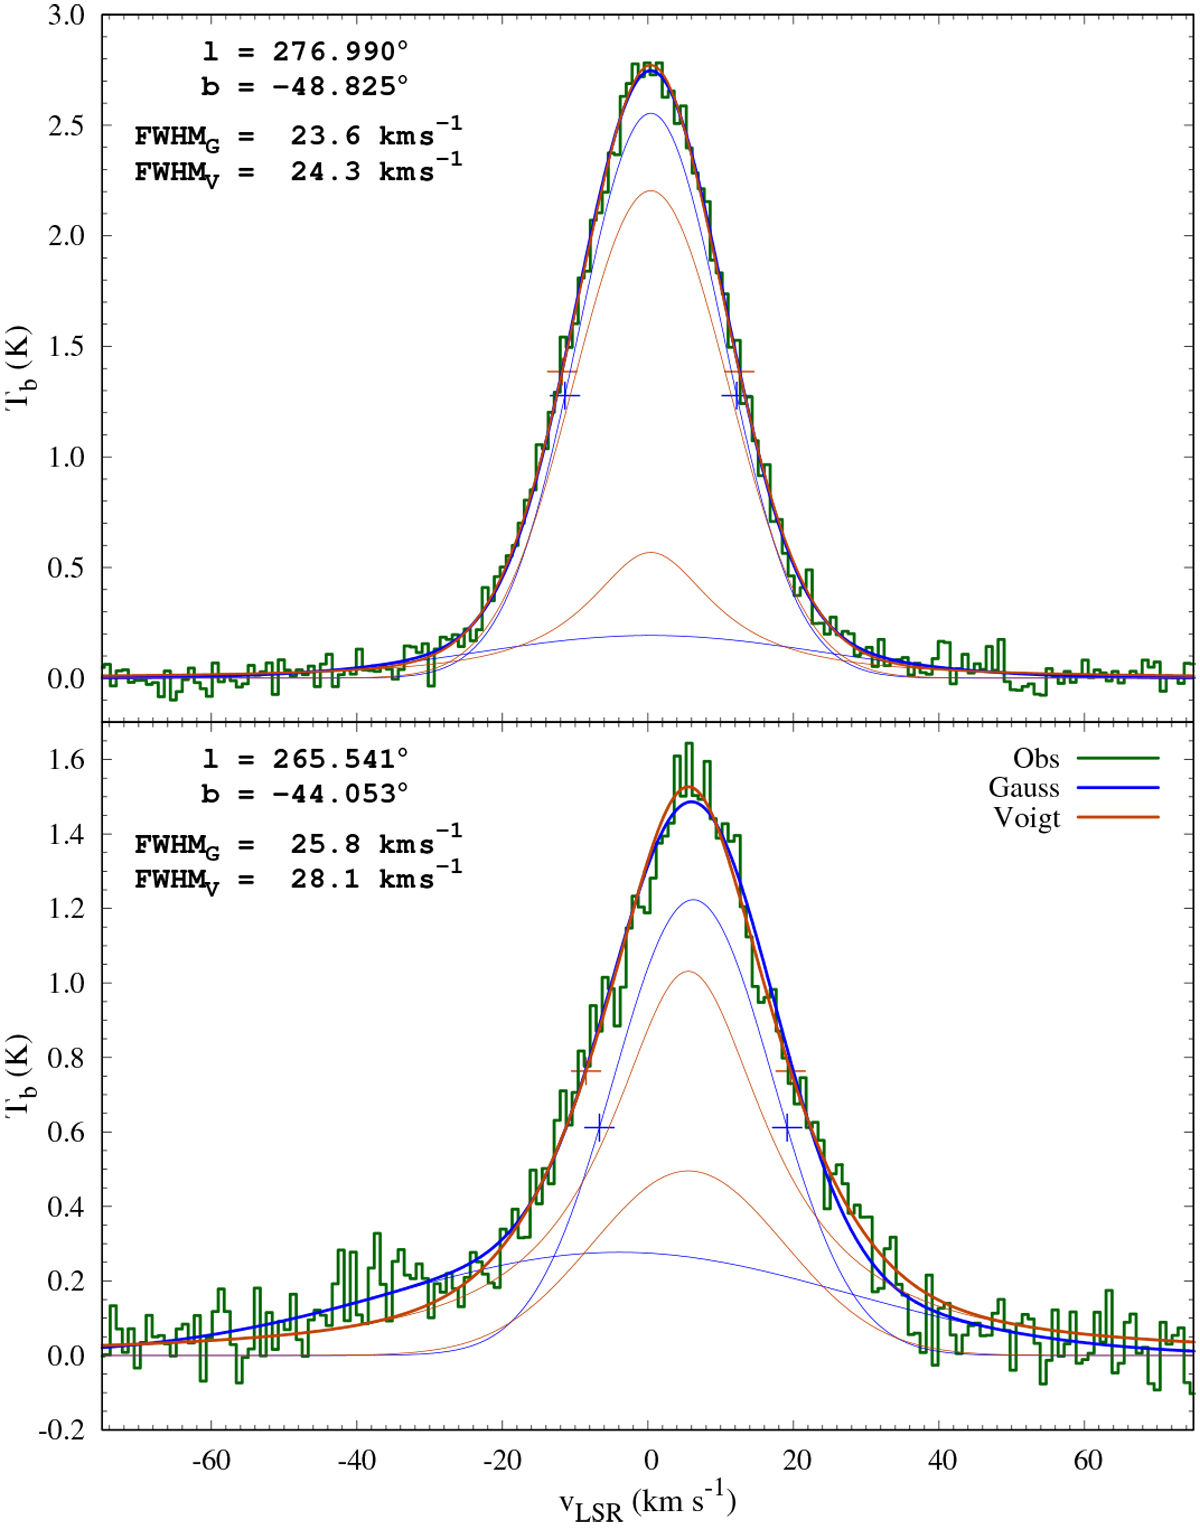
Two example fits of the observations with the Gaussian components and with the pseudo-Voigt profile. The upper panel corresponds to the nearly ideal case for the fitting with the pseudo-Voigt profile and the lower panel represents the typical situation. Thick lines correspond to the observations and the models. Thin lines illustrate the Gaussian and the Lorentzian contributions to the final models. Crosses mark the points, which define FWHMWMS in two different models.
Current usage metrics show cumulative count of Article Views (full-text article views including HTML views, PDF and ePub downloads, according to the available data) and Abstracts Views on Vision4Press platform.
Data correspond to usage on the plateform after 2015. The current usage metrics is available 48-96 hours after online publication and is updated daily on week days.
Initial download of the metrics may take a while.