Free Access
Fig. 5
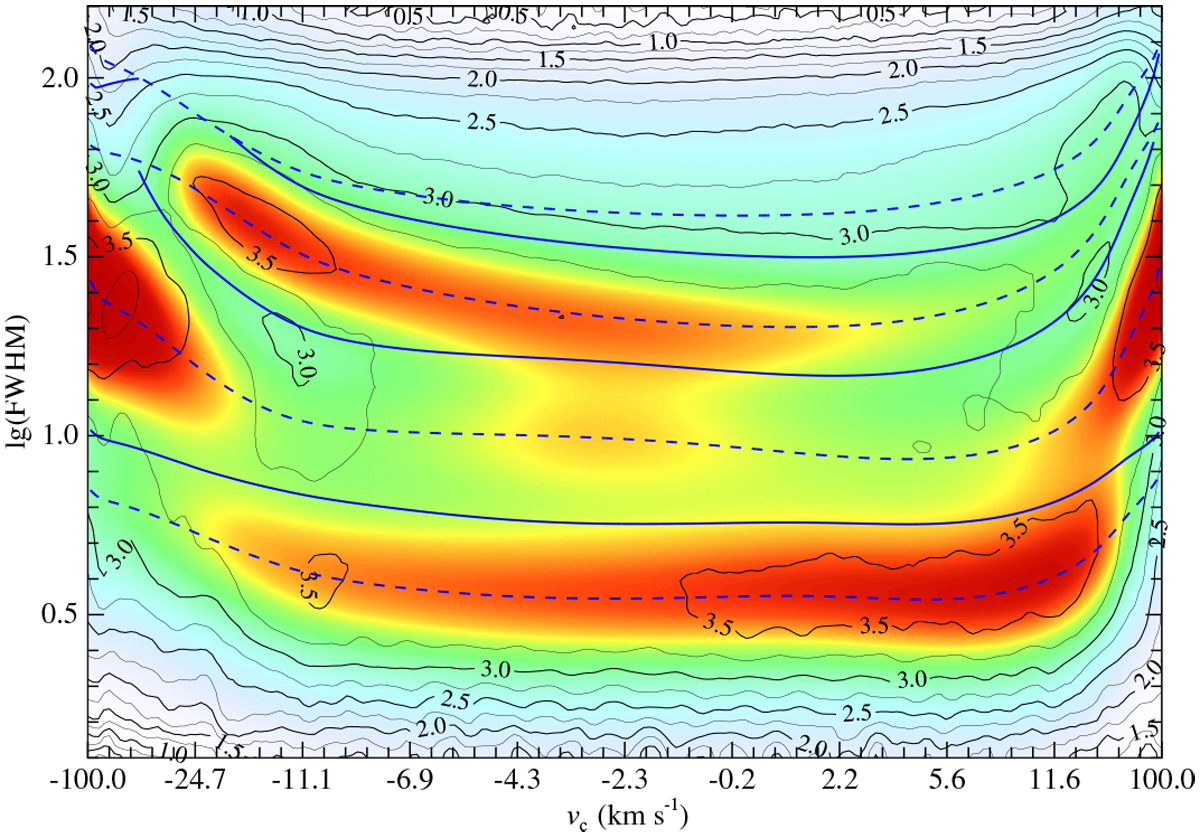
As Fig. 4, but the background colors now correspond to the sub-model for |vc | ≤ 99 km s−1 and NG ≤ 7 from the second model family. The blue dashed lines give the positions of the peaks of the fitted log-normal distributions and solid lines indicate the formal division between the modeled gas phases.
Current usage metrics show cumulative count of Article Views (full-text article views including HTML views, PDF and ePub downloads, according to the available data) and Abstracts Views on Vision4Press platform.
Data correspond to usage on the plateform after 2015. The current usage metrics is available 48-96 hours after online publication and is updated daily on week days.
Initial download of the metrics may take a while.