Fig. 7
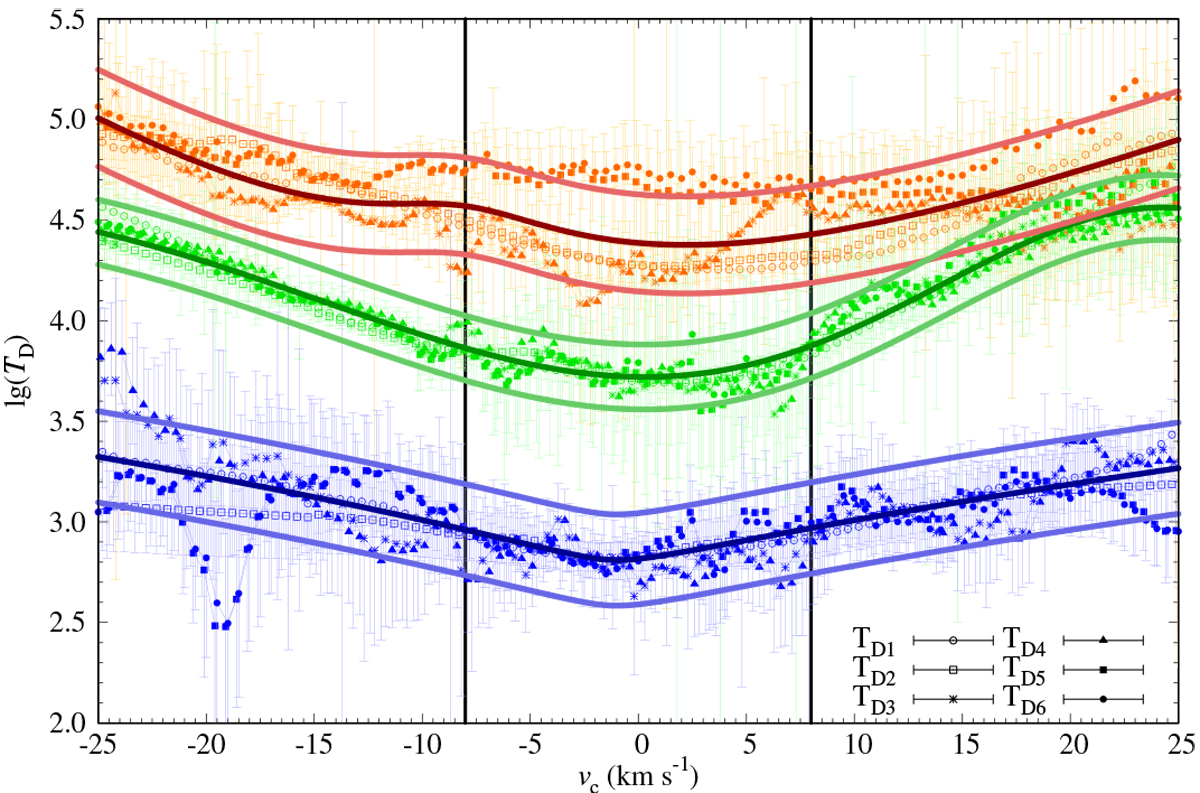
Results for TD,CL (blue), TD,LW (green), and TD,WX (red) from six model families TD1 − TD6. Each family is plotted with different symbols. The error bars correspond to the standard deviations of the sub-modelsin each family. The polynomial fits to the results from all families are plotted with the thick dark linesand the thick lighter lines give the corresponding median uncertainties in the velocity range |vc | ≤ 25 km s−1. Two vertical black lines indicate the velocity range |vc|≤ 8 km s−1, used for the discussions.
Current usage metrics show cumulative count of Article Views (full-text article views including HTML views, PDF and ePub downloads, according to the available data) and Abstracts Views on Vision4Press platform.
Data correspond to usage on the plateform after 2015. The current usage metrics is available 48-96 hours after online publication and is updated daily on week days.
Initial download of the metrics may take a while.