Fig. 1.
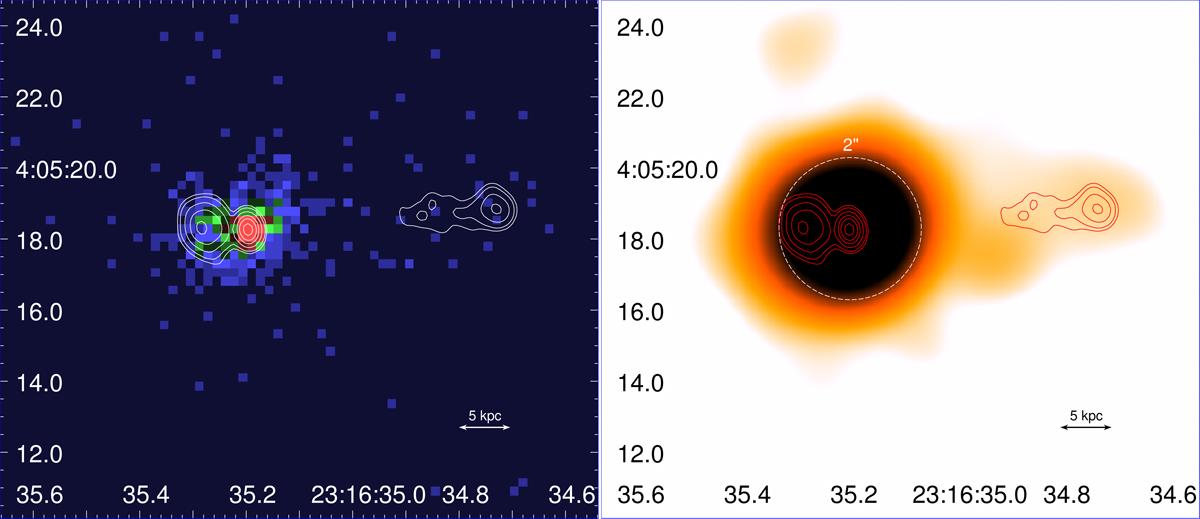
Left panel: unsmoothed map of the Chandra count rate in the 0.5–7.0 keV band, each pixel corresponding to 0.246″, that is half the native Chandra pixel size. The radio contours from a VLA map in the C band have been overlaid (white line): they start at 0.48 mJy beam−1 and stop at 0.24 Jy beam−1 in correspondence of the core. Right panel: Chandra flux map in the same energy band: a circle with a radius of 2″ is centered at the coordinates of the core.
Current usage metrics show cumulative count of Article Views (full-text article views including HTML views, PDF and ePub downloads, according to the available data) and Abstracts Views on Vision4Press platform.
Data correspond to usage on the plateform after 2015. The current usage metrics is available 48-96 hours after online publication and is updated daily on week days.
Initial download of the metrics may take a while.