Fig. 17
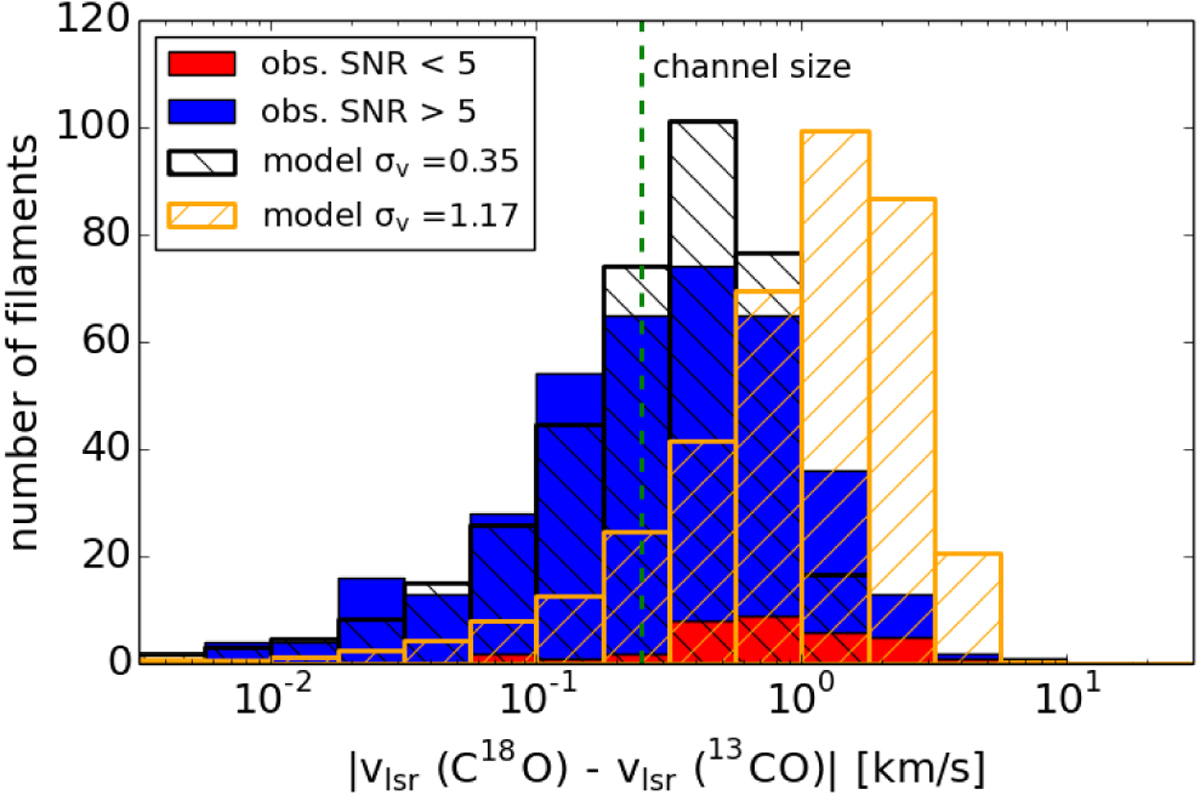
Histogram of the absolute velocity difference. Sources with S∕N < 5 are shown in red. On top the model difference distributions given by a underlying Gaussian velocity distribution with a dispersion of1.17 km s−1 (orange) and0.35 km s−1 (black) are shown. The green dashed line indicates the velocity channel size of the data.
Current usage metrics show cumulative count of Article Views (full-text article views including HTML views, PDF and ePub downloads, according to the available data) and Abstracts Views on Vision4Press platform.
Data correspond to usage on the plateform after 2015. The current usage metrics is available 48-96 hours after online publication and is updated daily on week days.
Initial download of the metrics may take a while.