Fig. 21
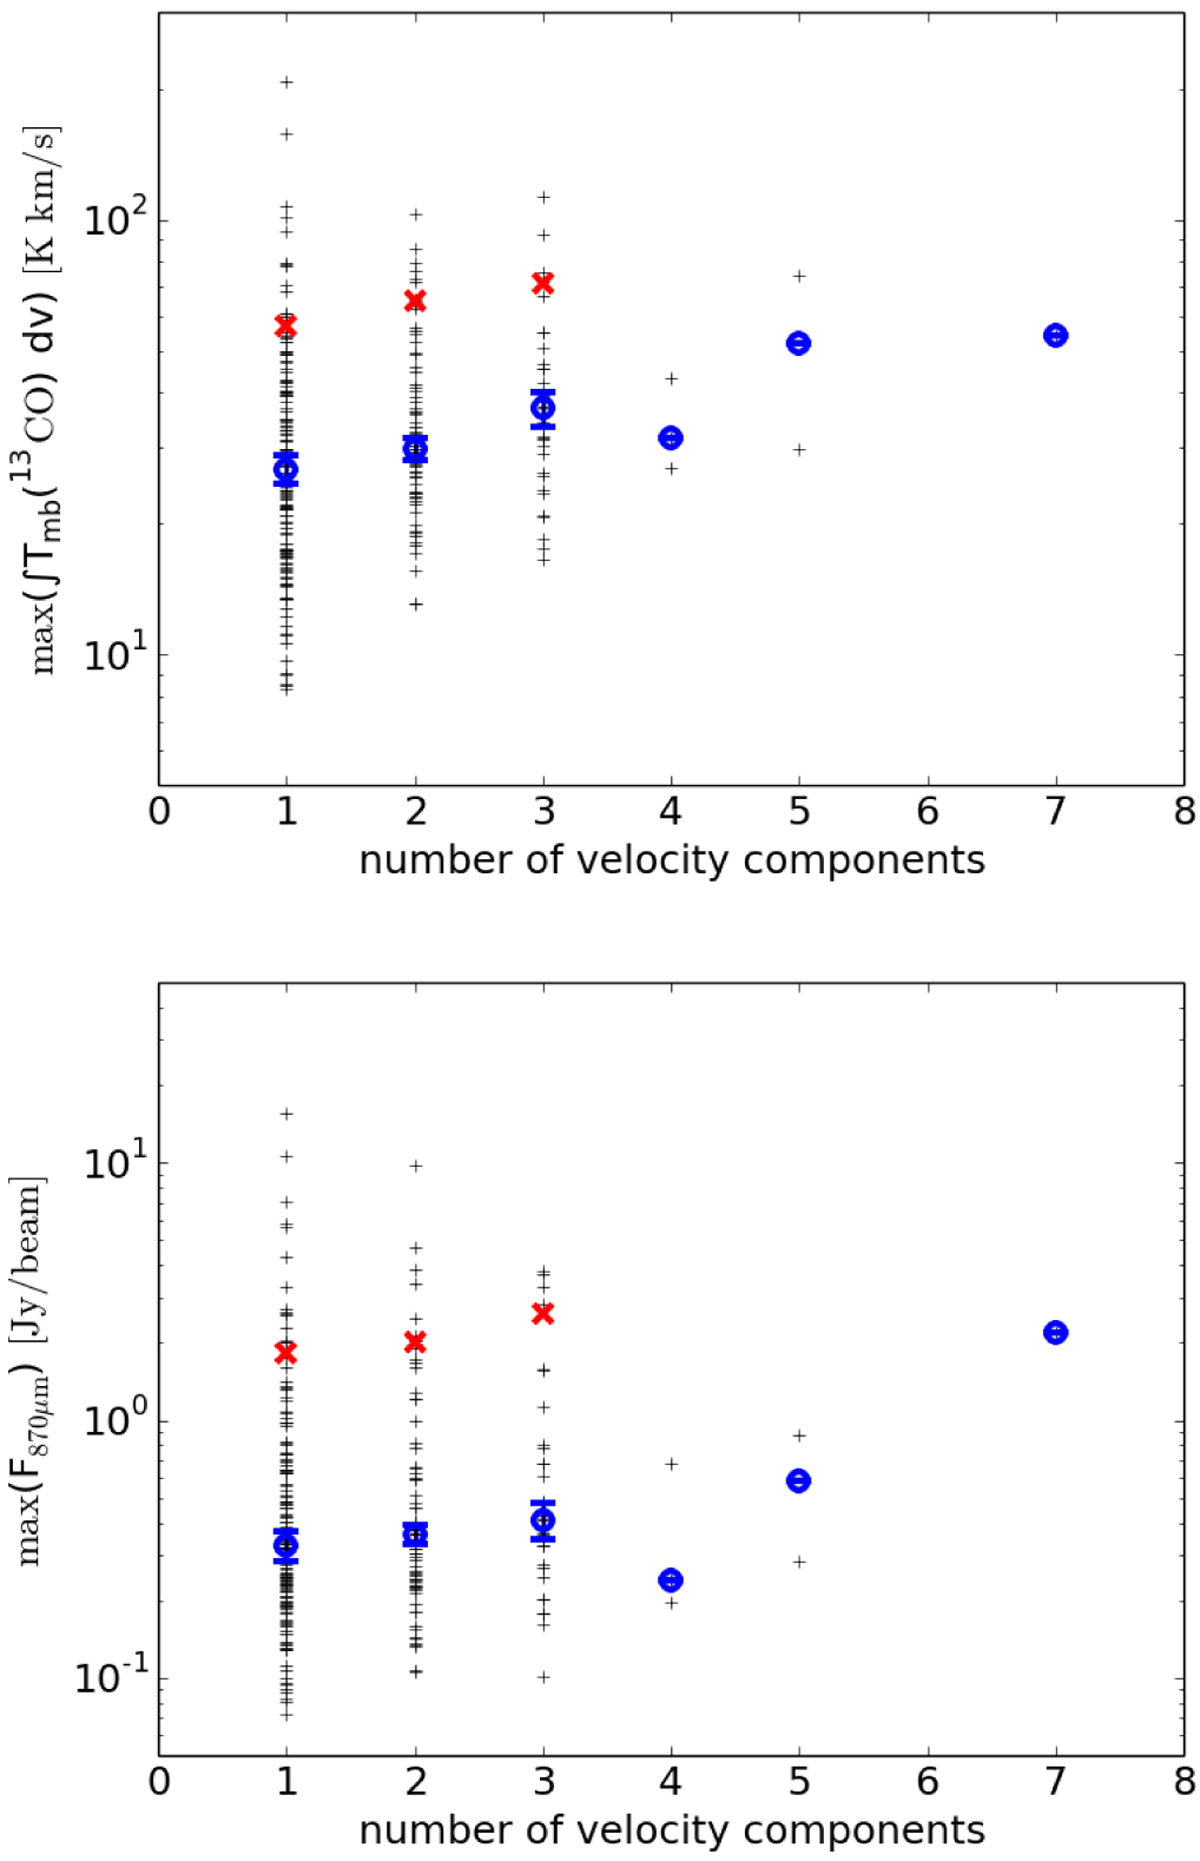
Peak integrated 13CO intensity (top panel) and peak ATLASGAL dust intensity (bottom panel) of a filament against the number of velocity components. The blue circles mark the median, and the red crosses mark the 90th percentile for each number of components. The error-bars show the uncertainty of the median derived by bootstrapping.
Current usage metrics show cumulative count of Article Views (full-text article views including HTML views, PDF and ePub downloads, according to the available data) and Abstracts Views on Vision4Press platform.
Data correspond to usage on the plateform after 2015. The current usage metrics is available 48-96 hours after online publication and is updated daily on week days.
Initial download of the metrics may take a while.