Fig. 27
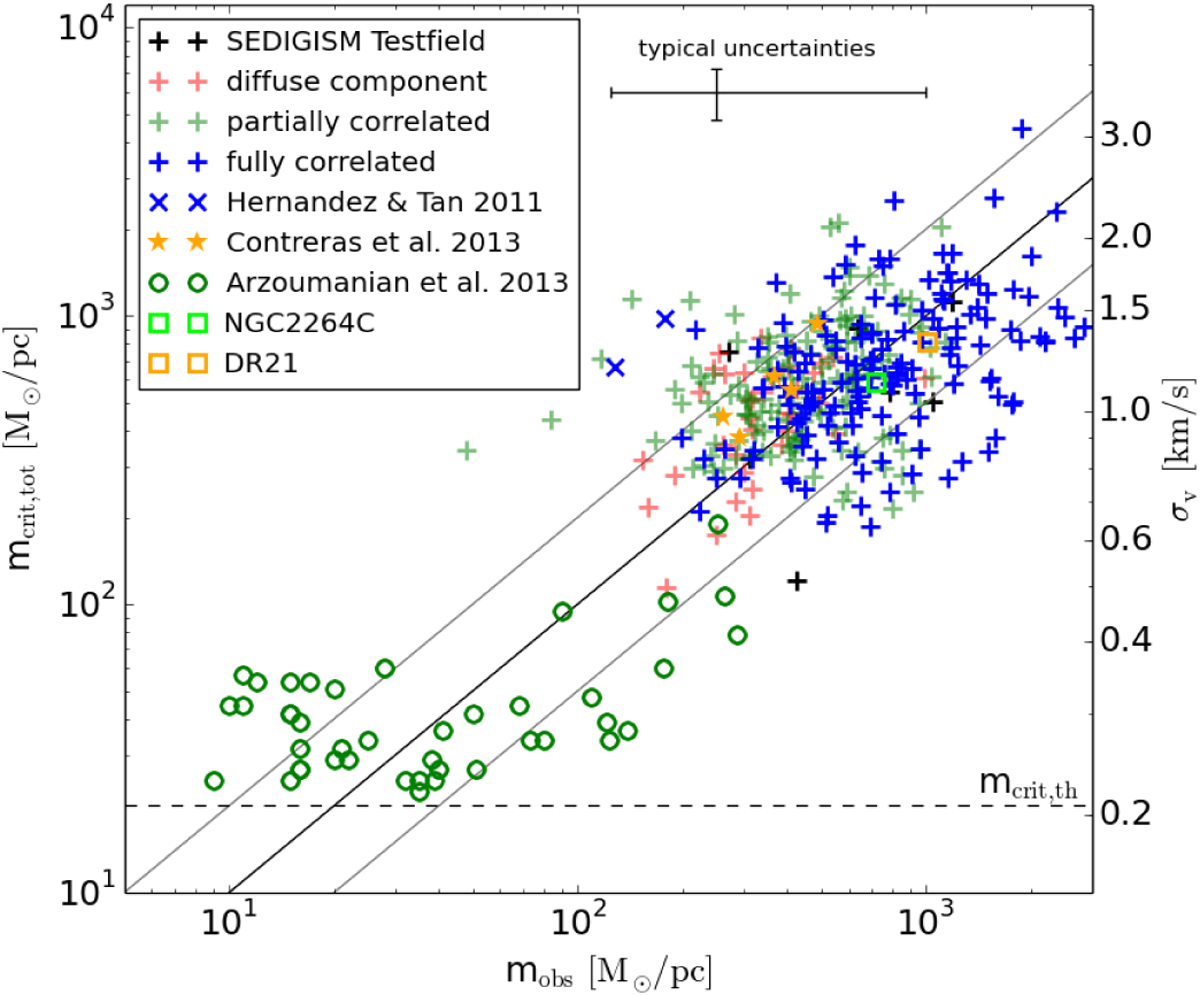
Critical, non-thermal line-mass derived from the velocity dispersion versus observed line-mass using integrated 13CO. The fully correlated filaments are indicated in blue, and the other filaments of this study in a shaded green and red. The black solid line shows the one-to-one correlation, the gray lines indicate a factor 2 uncertainty, and the dashed line shows the critical thermal line-mass.
Current usage metrics show cumulative count of Article Views (full-text article views including HTML views, PDF and ePub downloads, according to the available data) and Abstracts Views on Vision4Press platform.
Data correspond to usage on the plateform after 2015. The current usage metrics is available 48-96 hours after online publication and is updated daily on week days.
Initial download of the metrics may take a while.