Fig. 5
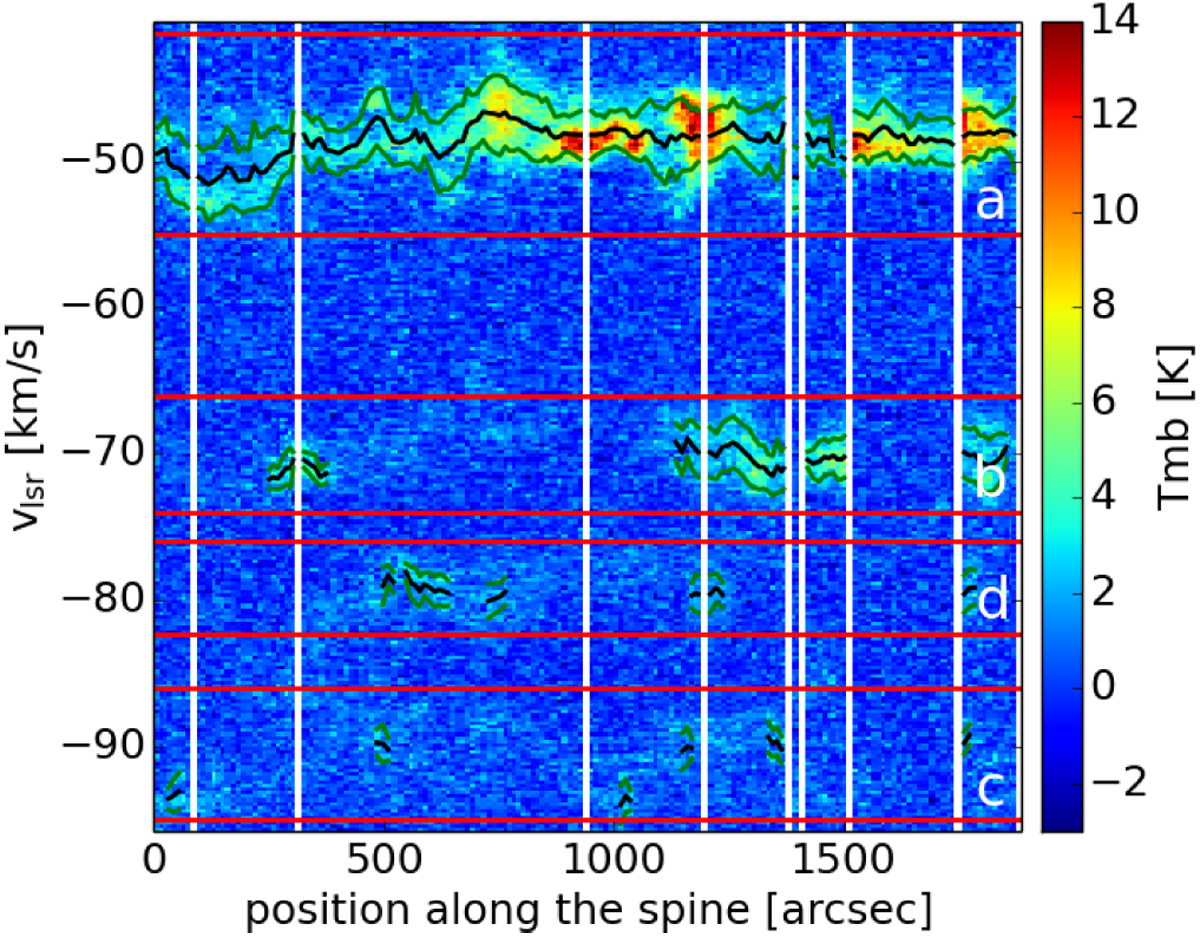
Position–velocity plot of the intensity along the skeleton of the filament candidate G333.297+00.073. The white stripes indicate the beginning/end of a skeleton branch. The first five branches show the longest connection through the skeleton from higher to lower galactic longitude and the last four are the branches to the side in the same direction. The horizontal red lines mark the identified emission intervals shown in Fig. 3 with intervals a, b, d, c from top to bottom. The jagged black and green lines mark the per pixel measured peak velocity and the 1σ interval of the detected emission peak.
Current usage metrics show cumulative count of Article Views (full-text article views including HTML views, PDF and ePub downloads, according to the available data) and Abstracts Views on Vision4Press platform.
Data correspond to usage on the plateform after 2015. The current usage metrics is available 48-96 hours after online publication and is updated daily on week days.
Initial download of the metrics may take a while.