Free Access
Fig. 2.
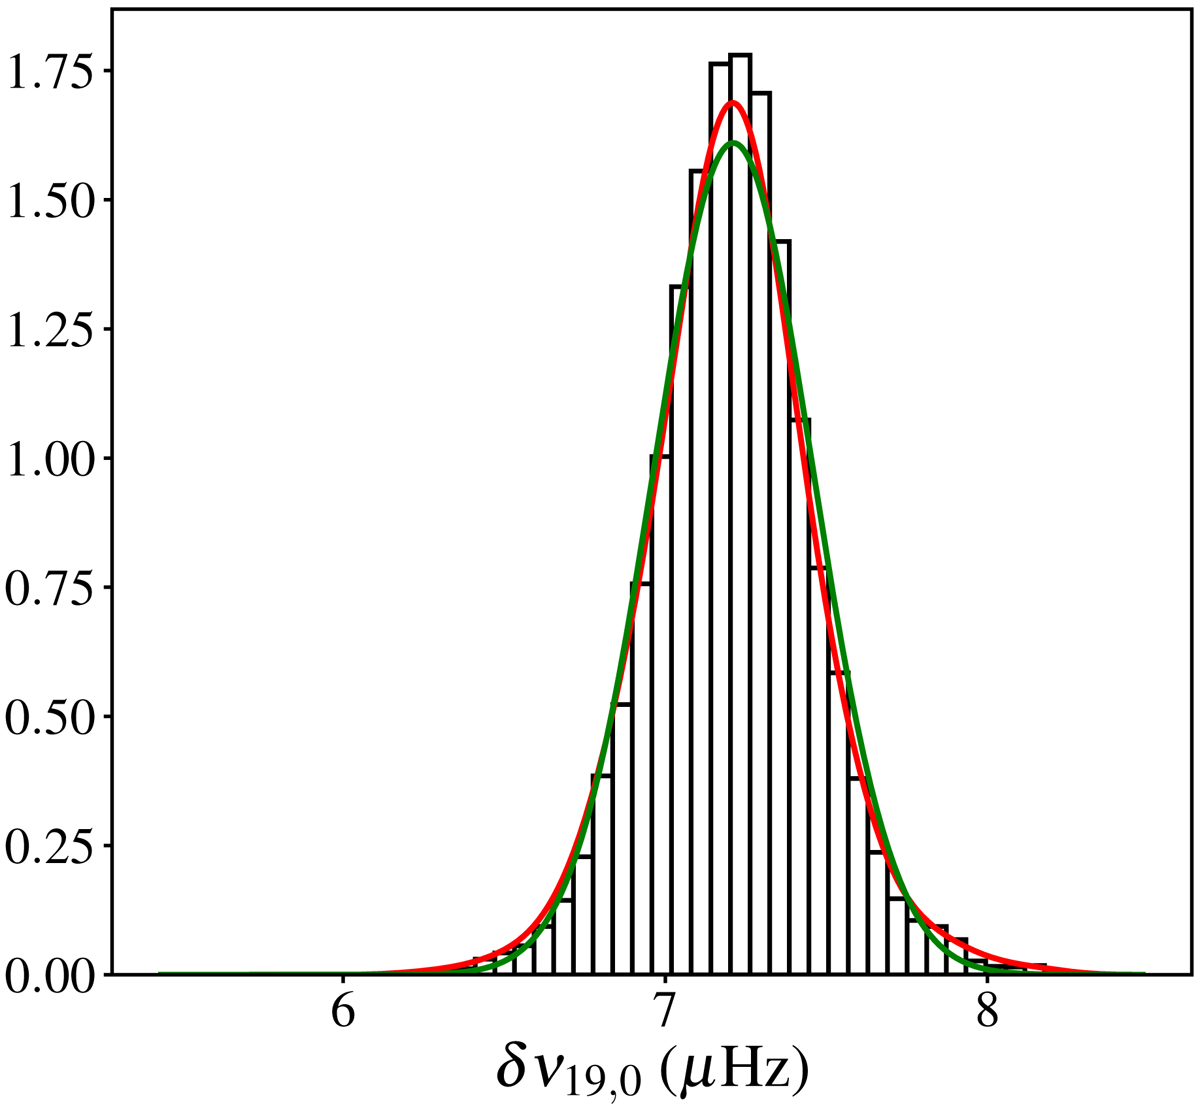
PDF for the small separation δν0, 19. The black lines represent the histogram estimation, the red line the kernel-density estimation and the green one the result of mixture model fitting.
Current usage metrics show cumulative count of Article Views (full-text article views including HTML views, PDF and ePub downloads, according to the available data) and Abstracts Views on Vision4Press platform.
Data correspond to usage on the plateform after 2015. The current usage metrics is available 48-96 hours after online publication and is updated daily on week days.
Initial download of the metrics may take a while.