Fig. 6.
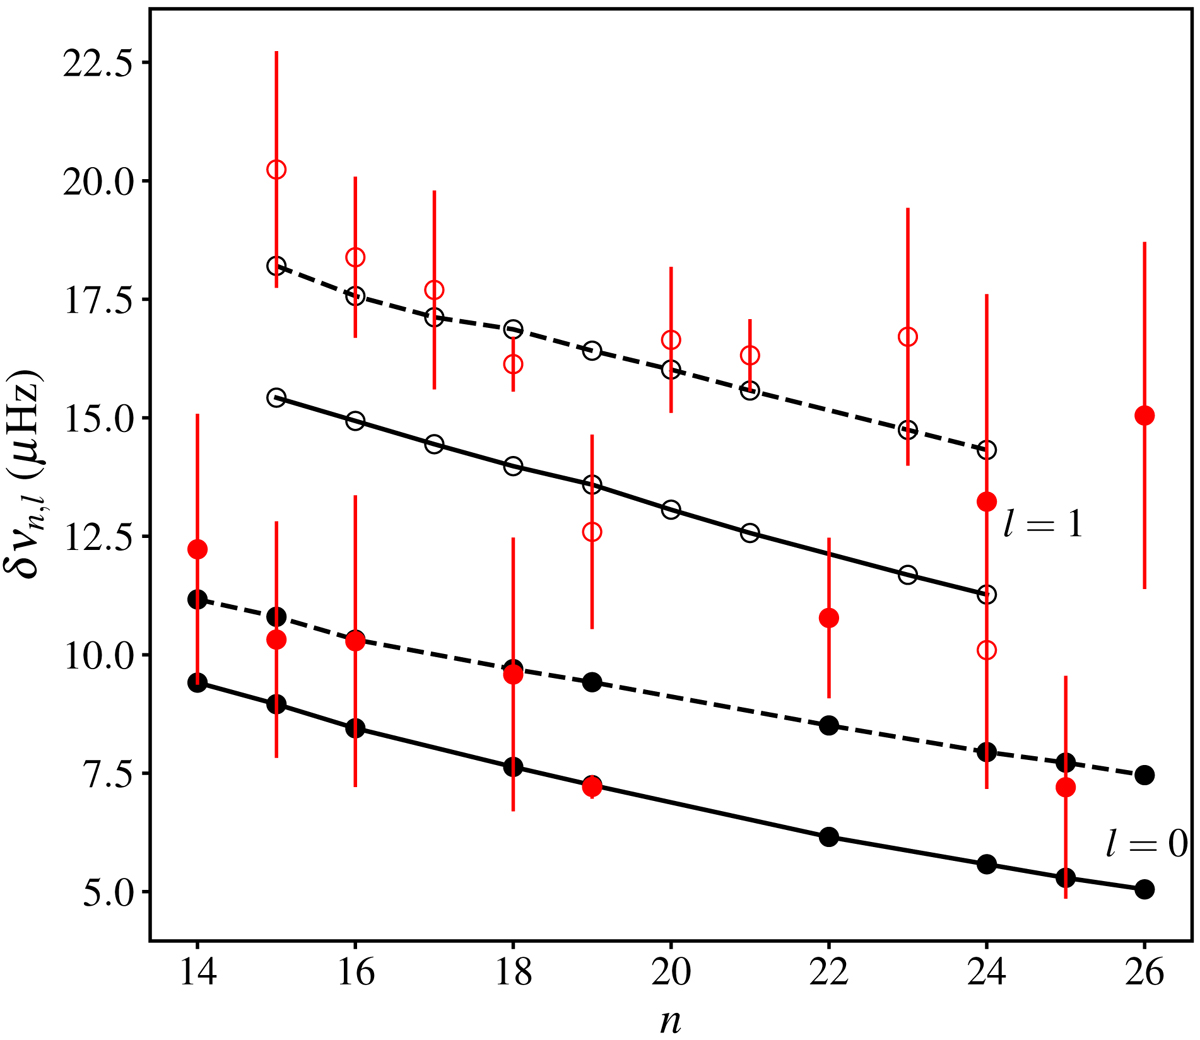
Observed and estimated small separations. The dashed lines show the small separations of the best model with t⋆ < 5 Gyr. The full lines show the small separations of the best model with t⋆ > 5 Gyr. The red dots show the mean of the observed small separations and their standard deviations. The full dots mark small separations with l = 0 and the open dots those with l = 1.
Current usage metrics show cumulative count of Article Views (full-text article views including HTML views, PDF and ePub downloads, according to the available data) and Abstracts Views on Vision4Press platform.
Data correspond to usage on the plateform after 2015. The current usage metrics is available 48-96 hours after online publication and is updated daily on week days.
Initial download of the metrics may take a while.