Fig. 9.
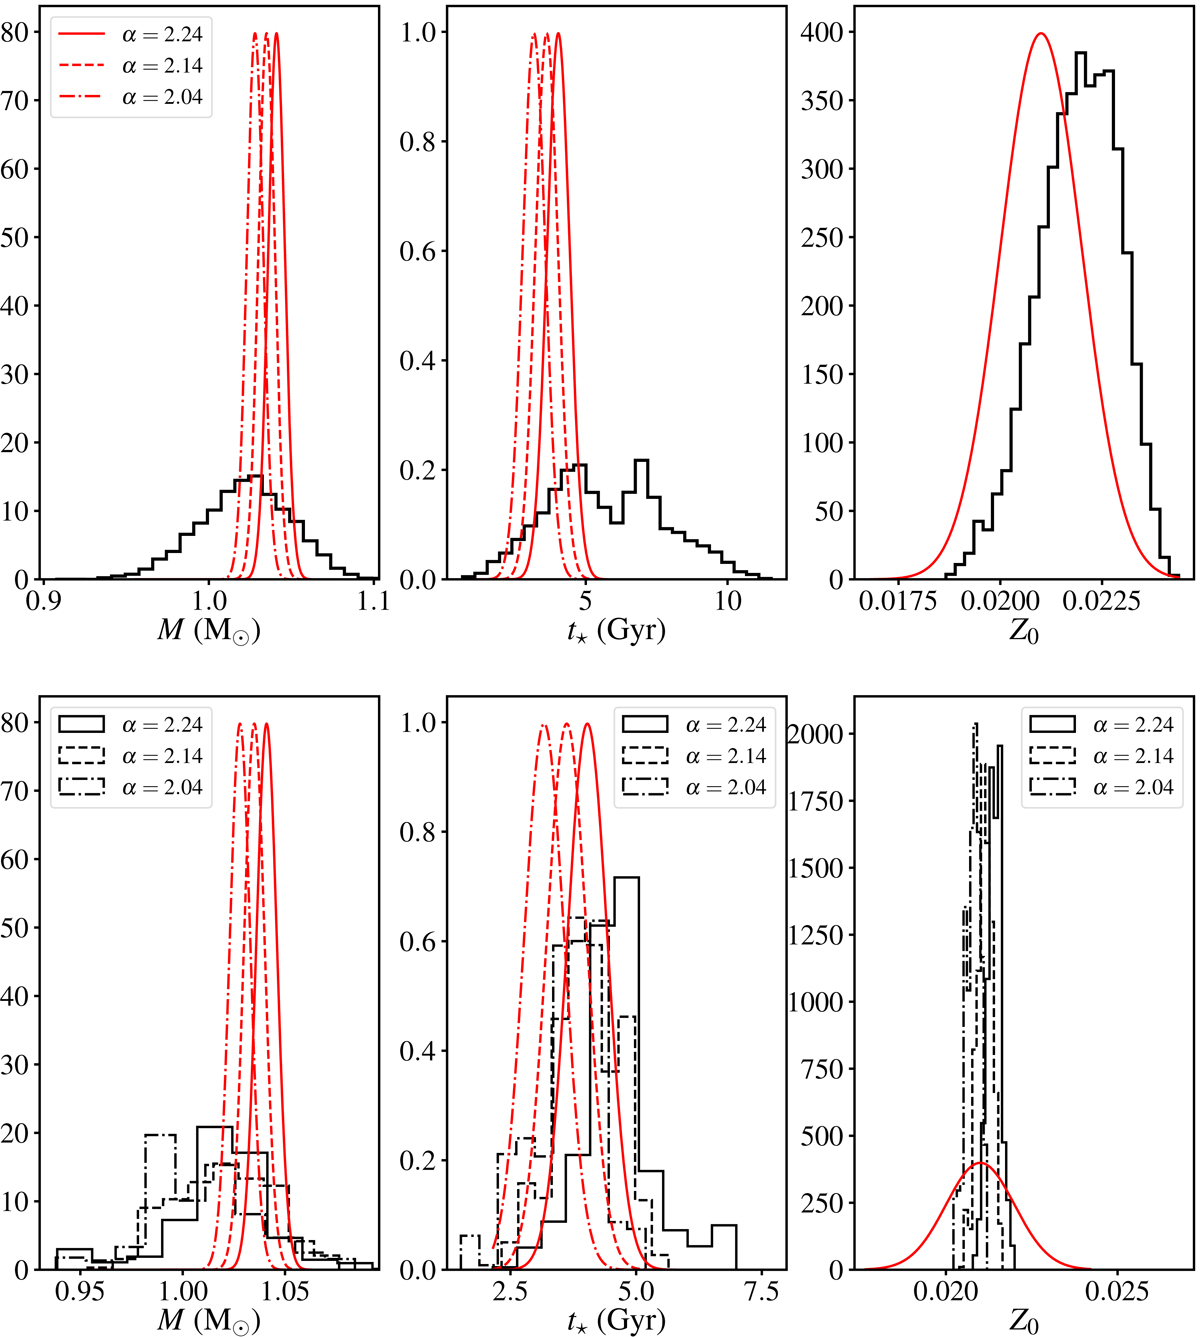
Upper row: marginal distributions (black) of M, t, and Z0 from the results presented in Fig. 3 (Sect. 3), and the distribution for these same parameters as determined from the local analysis (red Gaussians, Sect. 2.4, Table 5). Bottom row: marginal distributions for the same parameters, but restricted to a small interval around the values of α given in Table 5. The red lines are similar to those in the upper row.
Current usage metrics show cumulative count of Article Views (full-text article views including HTML views, PDF and ePub downloads, according to the available data) and Abstracts Views on Vision4Press platform.
Data correspond to usage on the plateform after 2015. The current usage metrics is available 48-96 hours after online publication and is updated daily on week days.
Initial download of the metrics may take a while.