Fig. 15
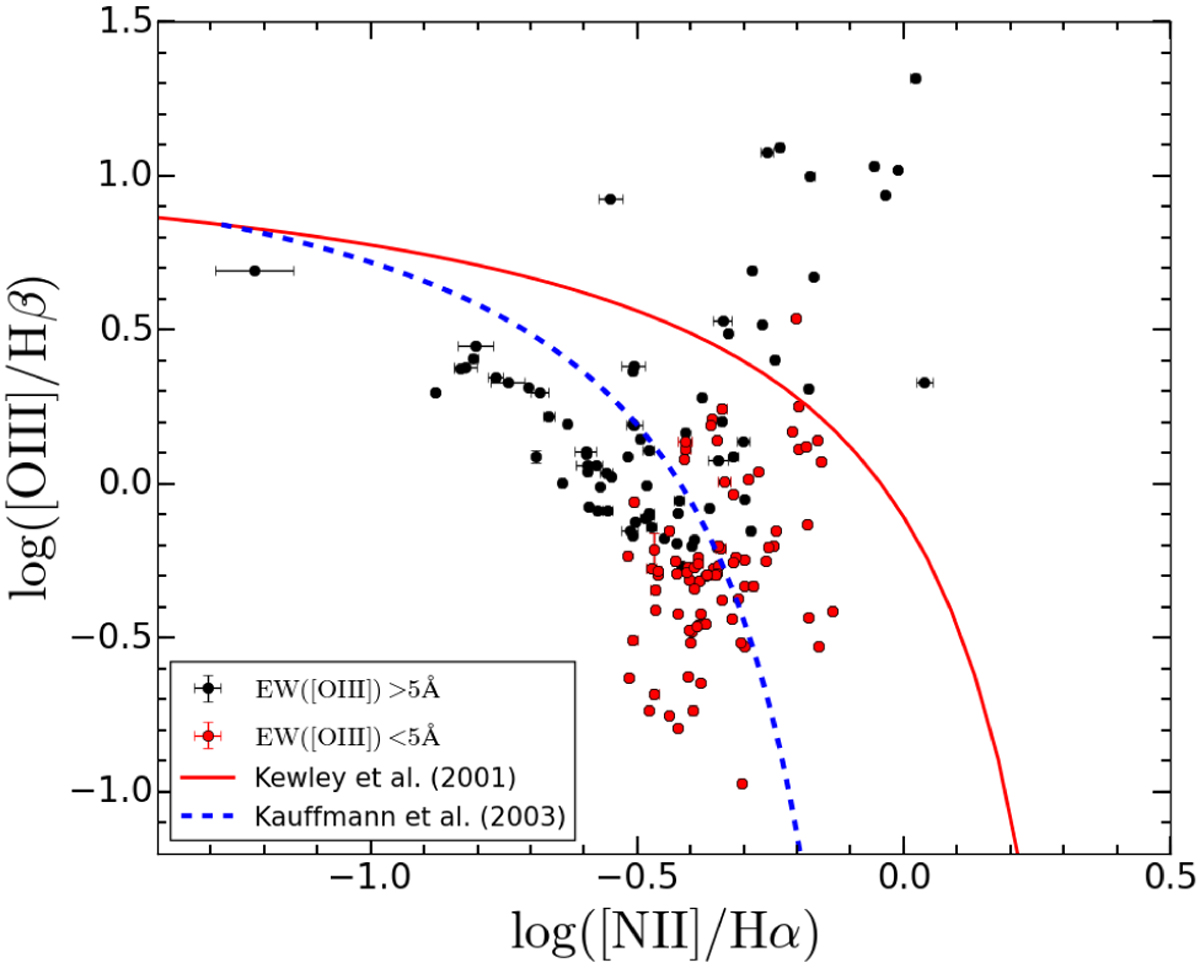
BPT diagram for radio sources in XXL-S. The red points are those for which EW([O III]) < 5 Å, and the black points are those for which EW([O III]) > 5 Å. The error bars were calculated according to Eqs. (13) and (14). The solid red line is the extreme starburst line from Kewley et al. (2001) and the dashed blue line is the star-forming galaxy line from Kauffmann et al. (2003).
Current usage metrics show cumulative count of Article Views (full-text article views including HTML views, PDF and ePub downloads, according to the available data) and Abstracts Views on Vision4Press platform.
Data correspond to usage on the plateform after 2015. The current usage metrics is available 48-96 hours after online publication and is updated daily on week days.
Initial download of the metrics may take a while.