Fig. 3.
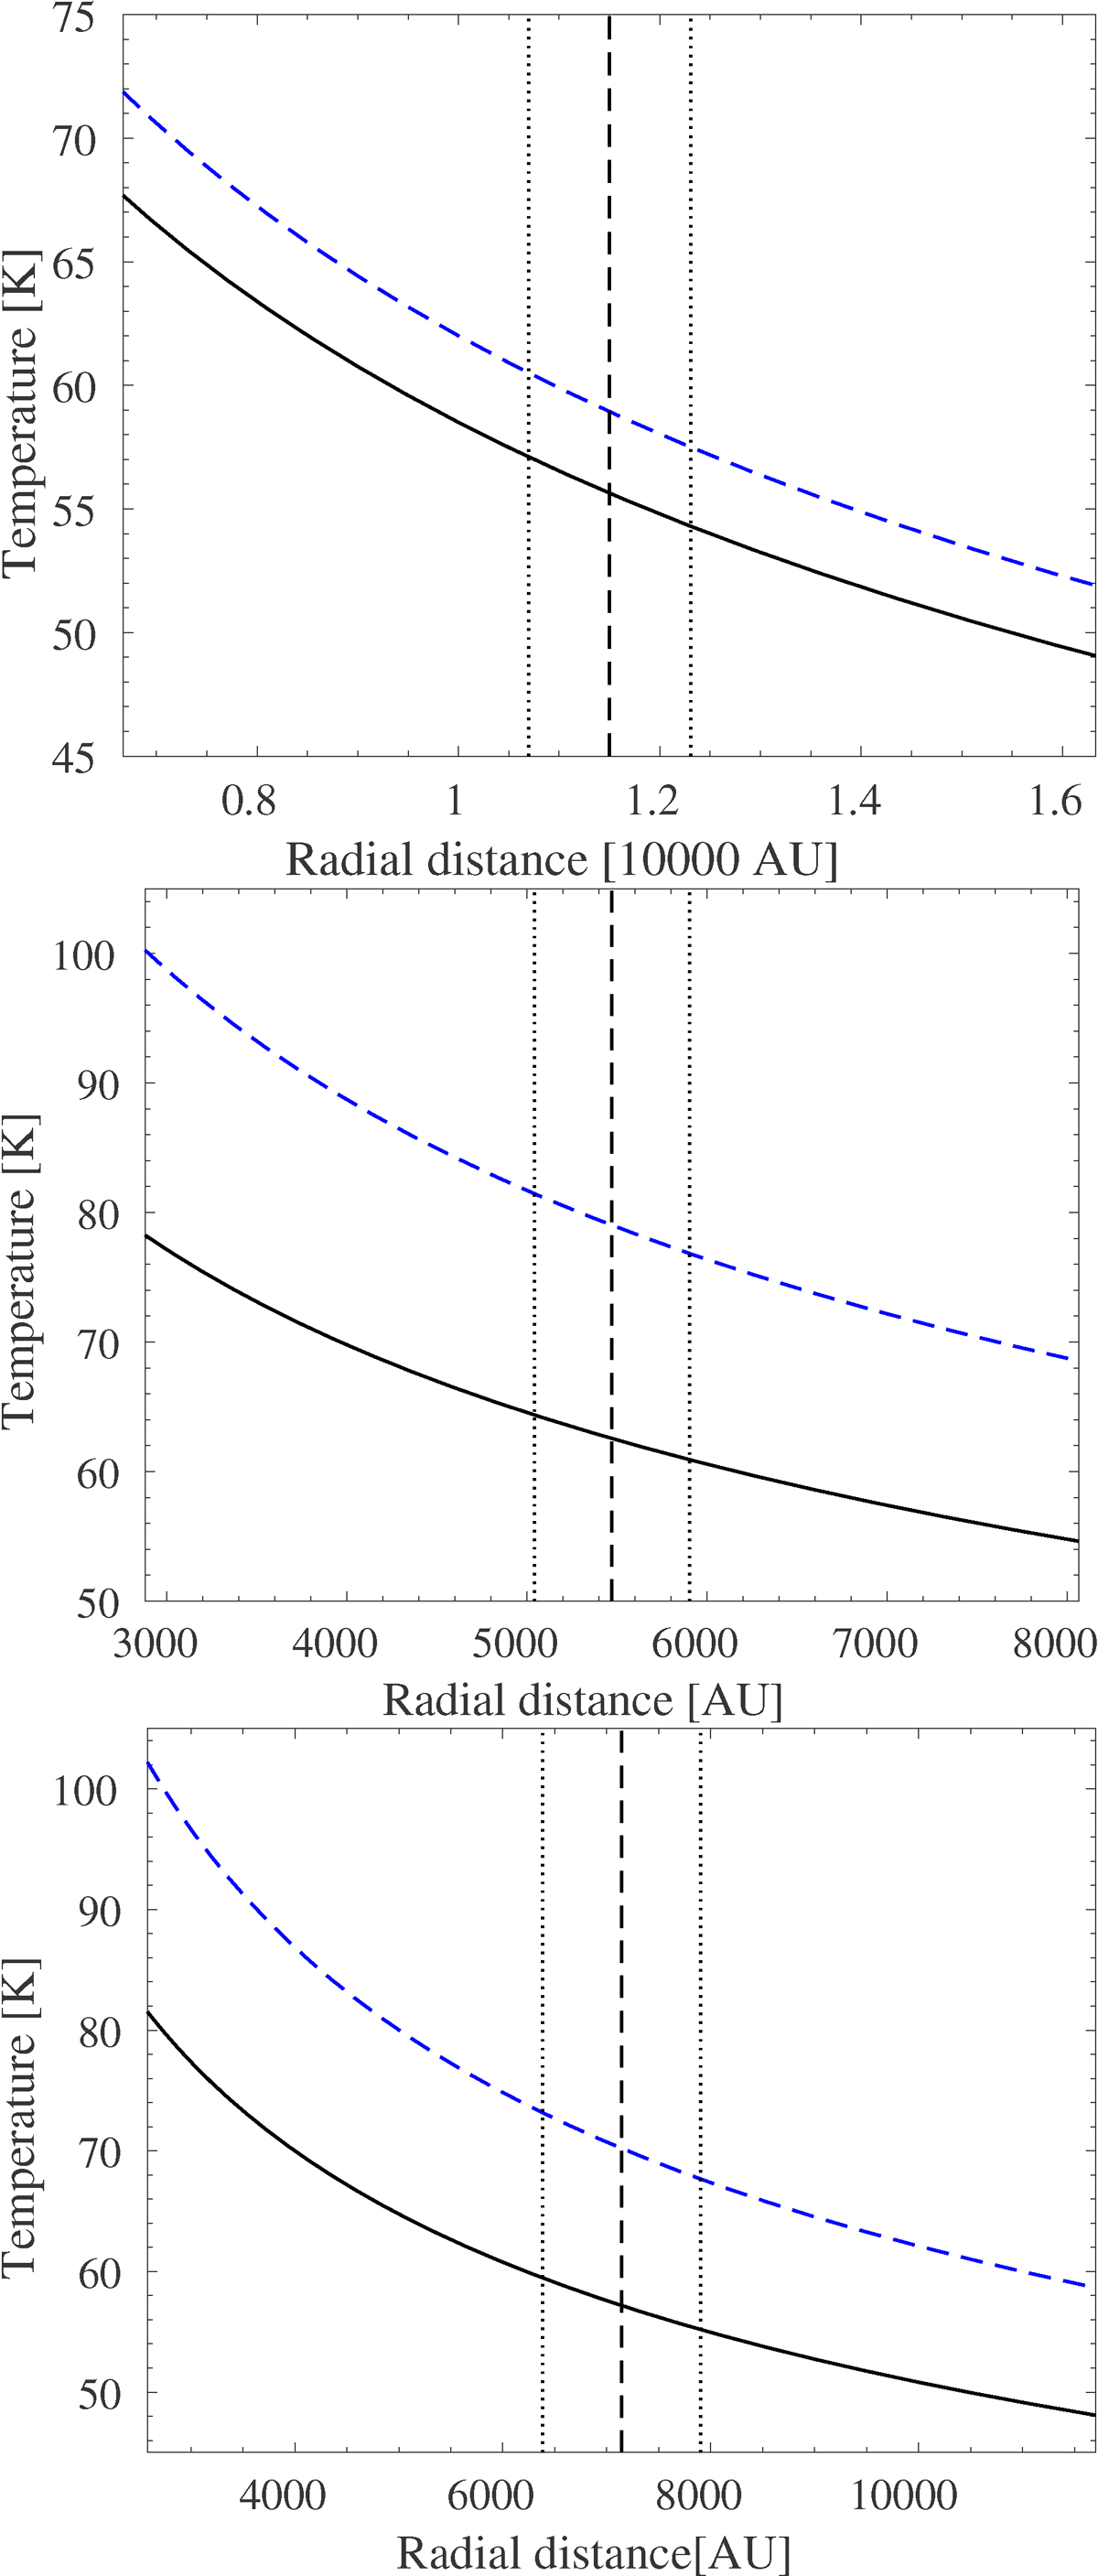
Temperature profiles at the positions of the shell for U Ant (top panel), DR Ser (middle panel), and V644 Sco (bottom panel). The vertical dashed lines show the radii of the shells, the vertical dotted lines indicate the FWHM of the shells. The blue dashed line shows the temperature profile for models with ad = 0.1 μm, and black solid line shows the temperature profile for models with ad = 1.0 μm (U Ant) and ad = 2.0 μm (DR Ser and V644 Sco).
Current usage metrics show cumulative count of Article Views (full-text article views including HTML views, PDF and ePub downloads, according to the available data) and Abstracts Views on Vision4Press platform.
Data correspond to usage on the plateform after 2015. The current usage metrics is available 48-96 hours after online publication and is updated daily on week days.
Initial download of the metrics may take a while.