Fig. 1
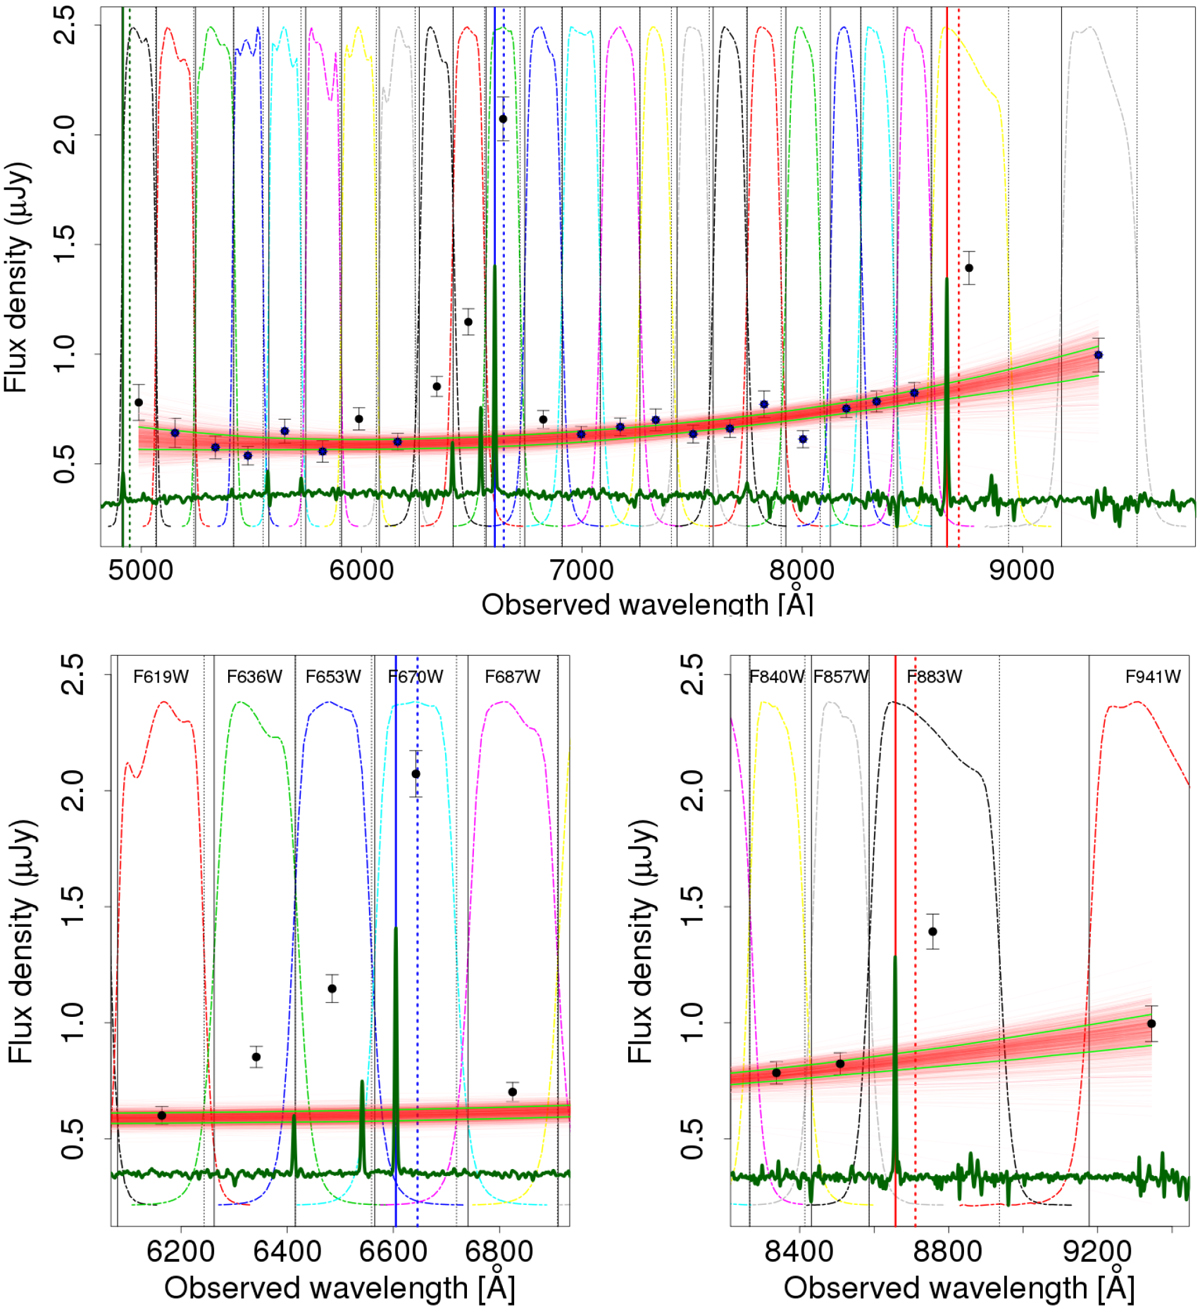
Top panel: SED of an ELG in our sample (SHARDS10003416) in black dots, overplotted on the transmission profile of SHARDS filters. The longslit spectrum (from the TKRS survey) is also shown in dark green. The 1000 Bootstrap continuum fits are shown in red, with the ± 1σ limits in green. Vertical dashed and continuous black lines indicate the lowest and highest wavelengths, respectively, for which each filter reaches 50% transmission rate. Vertical red and blue lines represent the expected wavelength of the Hα and [OIII]5007 lines, respectively, considering spectroscopic redshift (continuous lines) and photometric redshift derived in this work (dashed lines). Notorious flux excess can easily be seen in several filters, corresponding to emission lines. Bottom left panel: zoom into the [OIII]5007,4959 emission lines, using the same colours and symbols as the upper panel. Bottom right panel: zoom into the Hα line spectralregion.
Current usage metrics show cumulative count of Article Views (full-text article views including HTML views, PDF and ePub downloads, according to the available data) and Abstracts Views on Vision4Press platform.
Data correspond to usage on the plateform after 2015. The current usage metrics is available 48-96 hours after online publication and is updated daily on week days.
Initial download of the metrics may take a while.