Fig. 14
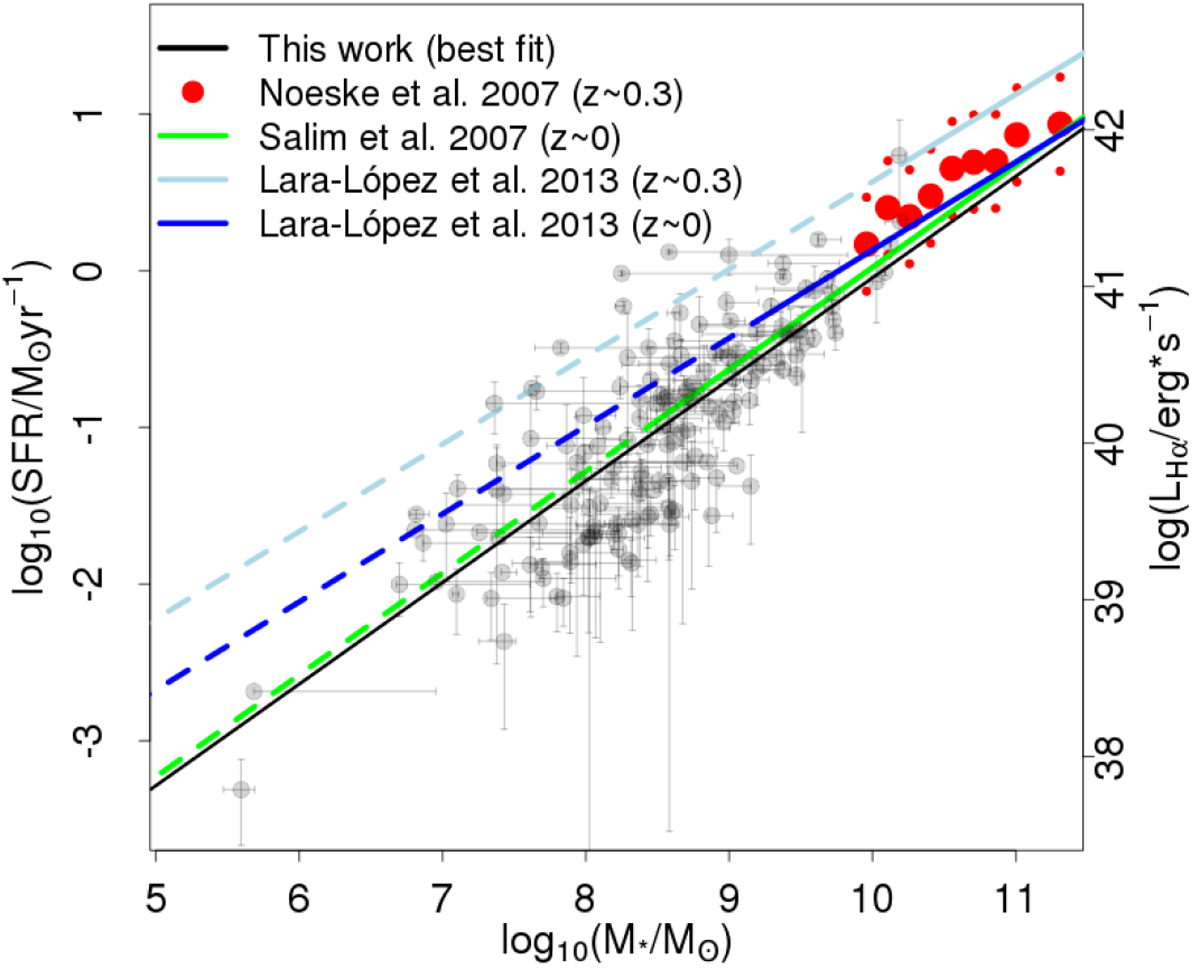
SFR of the ELG sample vs. stellar mass, in gray dots. The black line represents the best fit to our data. In light and dark blue, the relations presented in Lara-López et al. (2013) for z ~ 0.3 and z ~ 0 galaxies, respectively. The green line corresponds to the linear fit to Salim et al. (2007) data. The former three lines are continuous in the mass range where the respective samples are complete, and dashed otherwise. In large red dots, the median values for the z ~ 0.3 Noeske et al. (2007) sample (in smaller dots, the 1σ contours).
Current usage metrics show cumulative count of Article Views (full-text article views including HTML views, PDF and ePub downloads, according to the available data) and Abstracts Views on Vision4Press platform.
Data correspond to usage on the plateform after 2015. The current usage metrics is available 48-96 hours after online publication and is updated daily on week days.
Initial download of the metrics may take a while.