Fig. 8
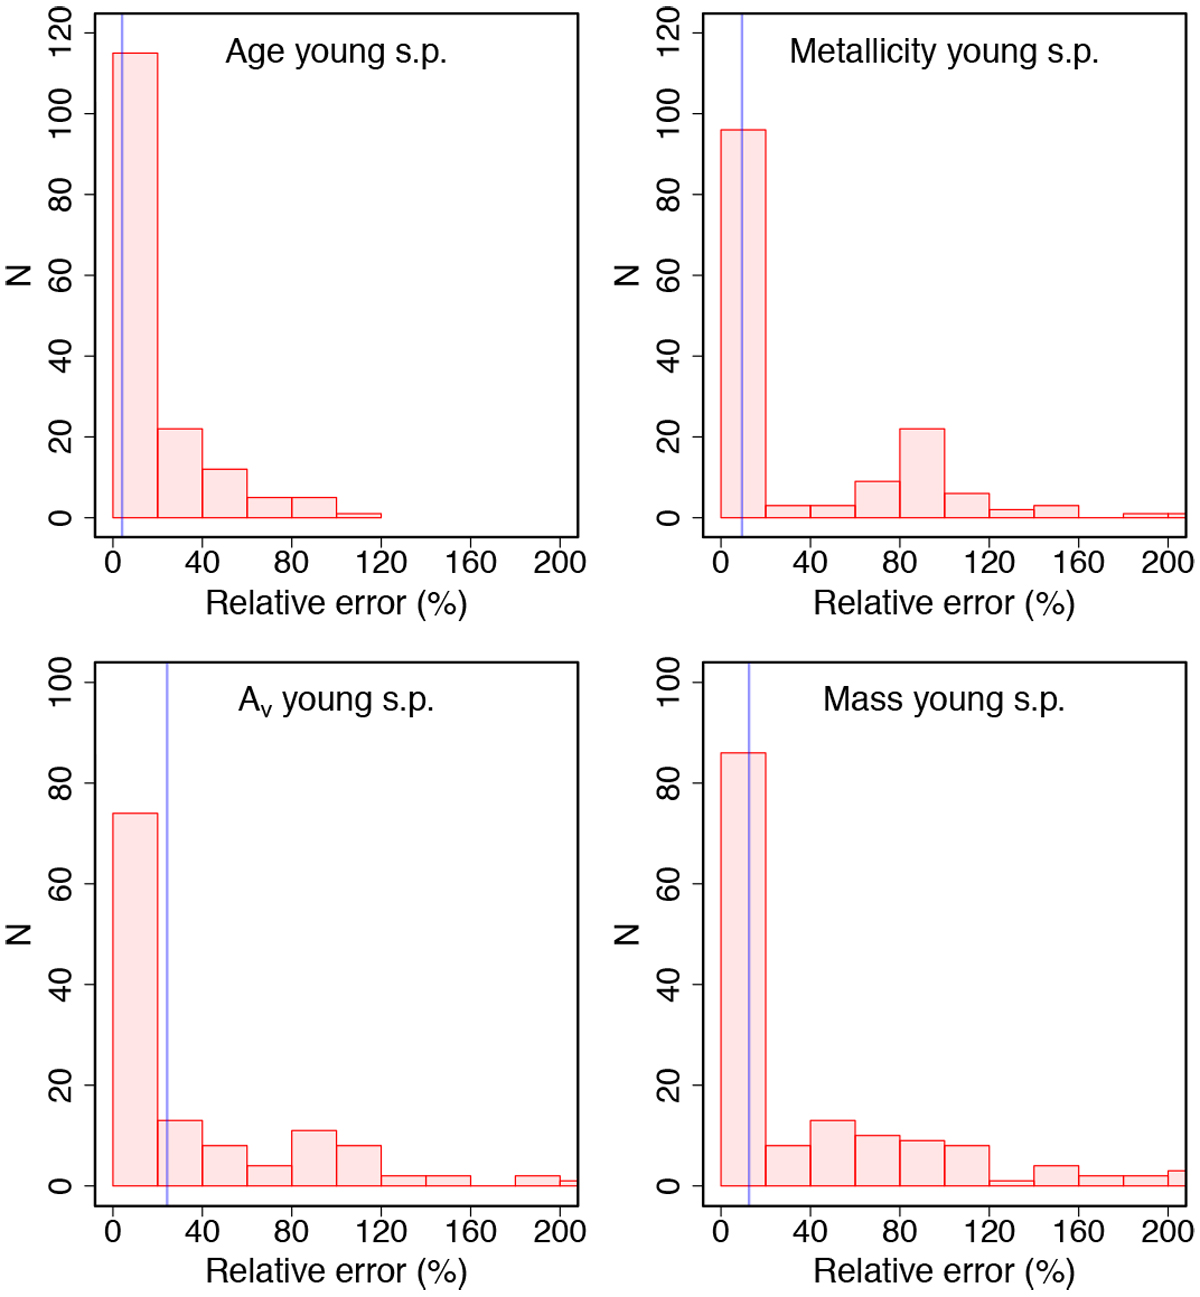
Histograms showing the relative uncertainty in each parameter of the young stellar population caused bythe degeneracy in the old population. Panel a: age, panel b: metallicity, panel c: extinction (AV), and panel d: mass. We derive the best value for each parameter in each galaxy, for all considered old stellar population ages. Then we take the width of its distribution for each galaxy and compute the relative error. We see that the changes in the best values are smaller than 20% in most cases. The blue lines represent the median value of the relative error.
Current usage metrics show cumulative count of Article Views (full-text article views including HTML views, PDF and ePub downloads, according to the available data) and Abstracts Views on Vision4Press platform.
Data correspond to usage on the plateform after 2015. The current usage metrics is available 48-96 hours after online publication and is updated daily on week days.
Initial download of the metrics may take a while.