Fig. B.4
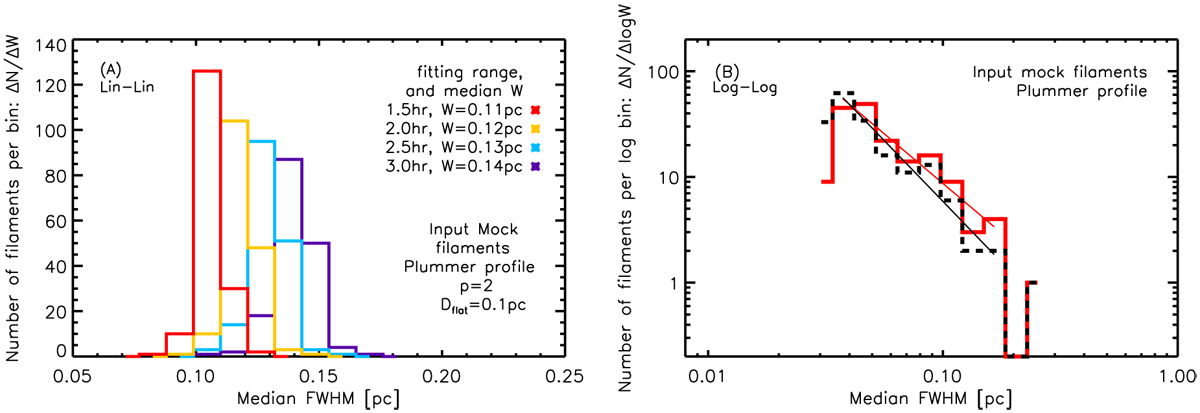
Histograms of FWHM widths derived from Gaussian fitting to the radial column density profiles of synthetic filaments with Plummer radial profiles and input contrast C0 = 1. Panel a: all input 180 mock filaments had Plummer radial profiles with 2Rflat = Dflat = 0.1 pc and p = 2. Results are presented for four choices of the fitting range, [0,1.5hr], [0,2.0hr], [0,2.5hr], and [0,3.0hr], color coded as shown at the top right of the plot (cf. Sect. 3.3.3). We note how the measured distribution of filament widths depends on the fitting range (the median filament width derived for each fitting range is given at the top right of the plot). Panel b: input 180 mock filaments had Plummer radial profiles with a power-law distribution of Dflat diameters between 0.03 and 0.25 pc (same distribution as the distribution of FWHMwidths in Fig. B.2B) and a Gaussian distribution of p values with a mean of 2 and a standard deviation of 0.3. The FWHM widths were derived from Gaussian fits to the radial column density profiles with a fitting range of [0,1.5hr]. The solid black and red straight lines show power-law fits to the input and measured distributions of widths, respectively.
Current usage metrics show cumulative count of Article Views (full-text article views including HTML views, PDF and ePub downloads, according to the available data) and Abstracts Views on Vision4Press platform.
Data correspond to usage on the plateform after 2015. The current usage metrics is available 48-96 hours after online publication and is updated daily on week days.
Initial download of the metrics may take a while.