Fig. 6.
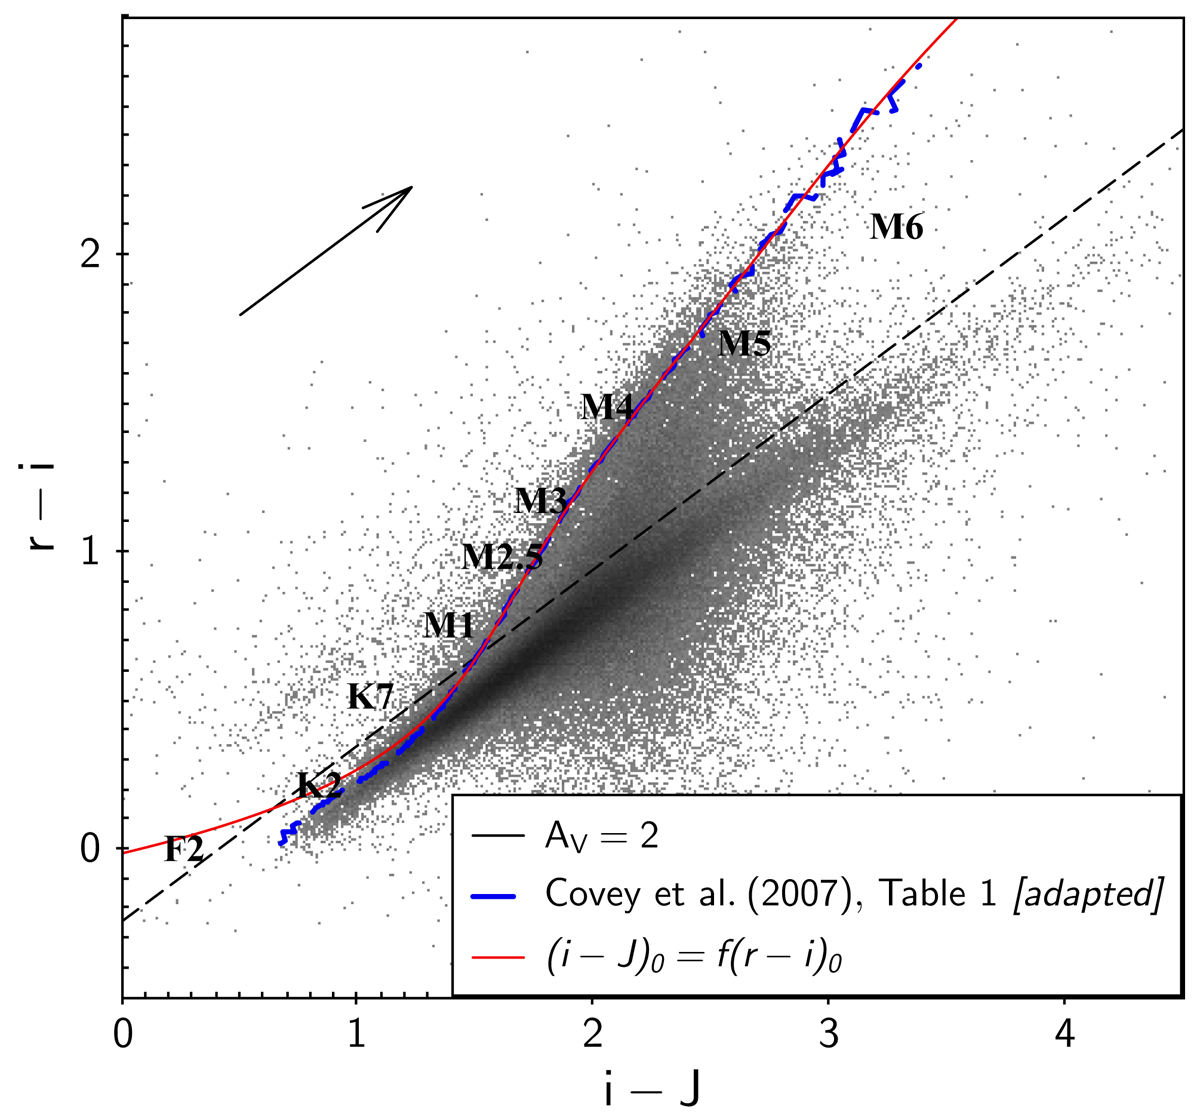
Distribution of r – i versus i – J colors for objects in the catalog built as in Sect. 2. The reddening vector is traced using the Aλ/AV reported in Sect. 3.1.1. The black dashed line corresponds to the empirical threshold traced by hand, parallel to the reddening vector, to separate the color locus of earlier type stars (nearly parallel to the reddening vector) from that of M-type stars. The color sequence traced in blue, adapted from Covey et al. (2007), is shown as a guidance to locate stars of different spectral types on the diagram. The red line, traced as a polynomial fit to the blue curve on the diagram, corresponds to the reference sequence adopted in this study to measure AV for M-type stars (see text).
Current usage metrics show cumulative count of Article Views (full-text article views including HTML views, PDF and ePub downloads, according to the available data) and Abstracts Views on Vision4Press platform.
Data correspond to usage on the plateform after 2015. The current usage metrics is available 48-96 hours after online publication and is updated daily on week days.
Initial download of the metrics may take a while.