Fig. 1.
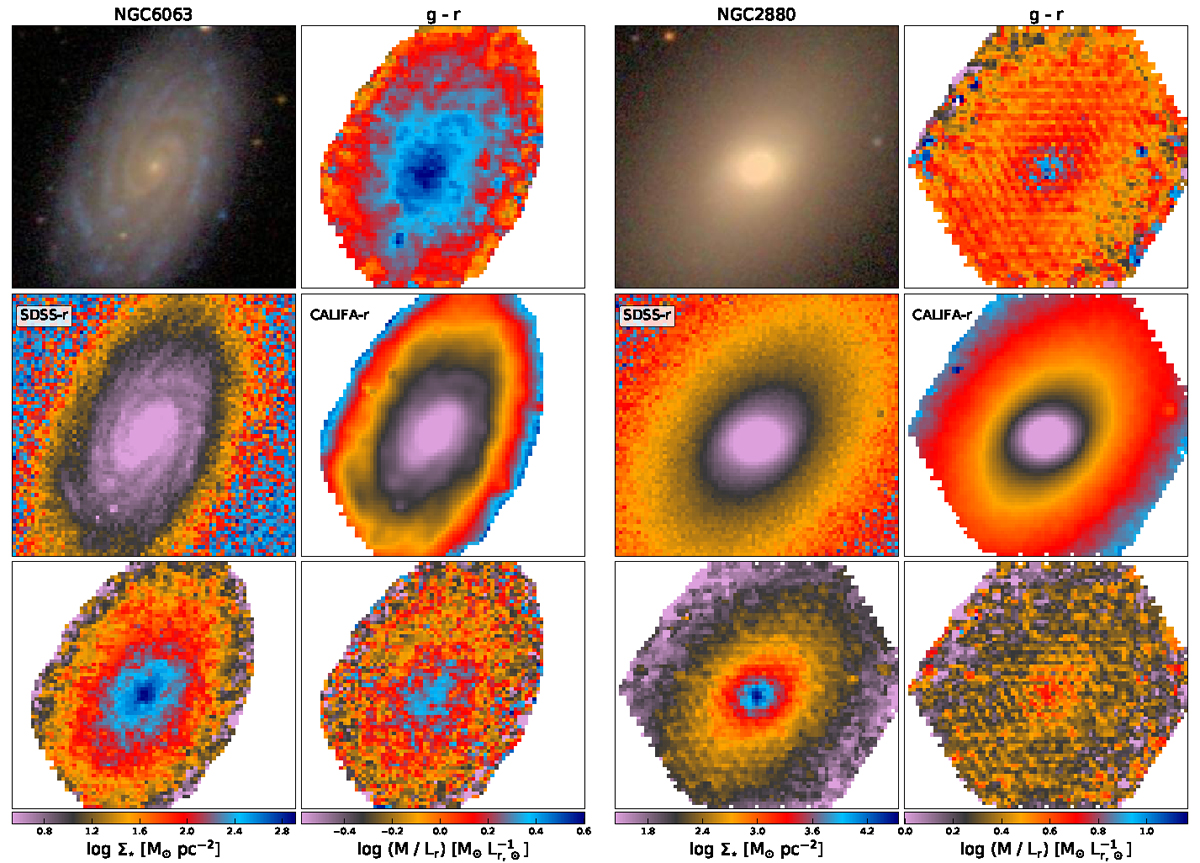
Examples of some of the data products used in the analysis of this work. 2D maps obtained from the CALIFA data cubes for NGC 6063 (unbarred Sbc, left panels) and NGC 2880 (E7, right panels). For each galaxy, the figure shows maps of g − r (upper right panel), r band (middle right panel), Σ⋆ (lower left panel), and M/Lr (lower right panel). For the sake of comparison, a three-color postage-stamp SDSS image (upper left panel) and an SDSS r band (middle left panel) reprojected to the same pixel scale as the CALIFA data cubes are also shown.
Current usage metrics show cumulative count of Article Views (full-text article views including HTML views, PDF and ePub downloads, according to the available data) and Abstracts Views on Vision4Press platform.
Data correspond to usage on the plateform after 2015. The current usage metrics is available 48-96 hours after online publication and is updated daily on week days.
Initial download of the metrics may take a while.