Fig. 3.
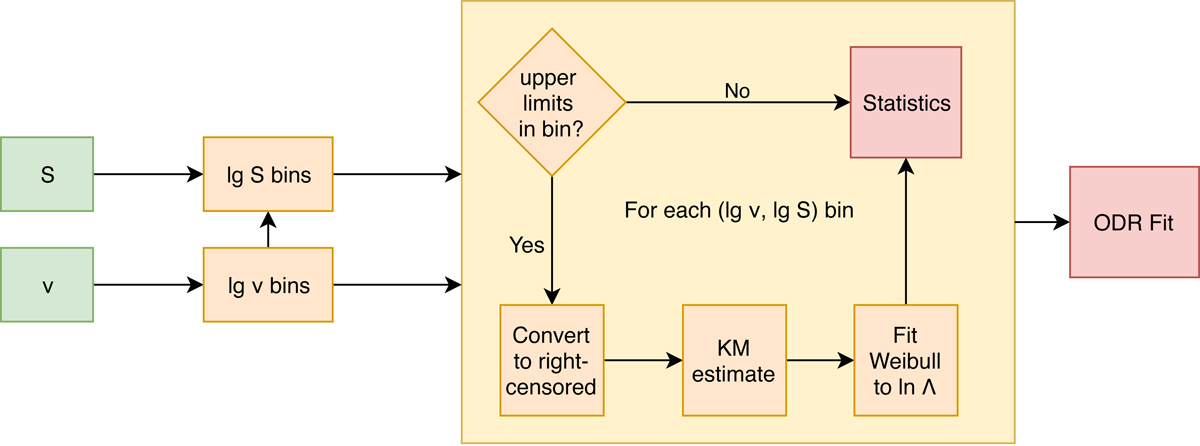
Flowchart of the radio SED fitting procedure described in Sect. 4.1. The input values are source fluxes, S, and rest-frame frequencies, ν. The log fluxes are then binned in log-rest-frame frequency bins. If there are no upper limits in a certain bin, the mean and standard deviation are calculated immediately, and if that is not the case, the log fluxes are converted into a right-censored dataset, and the Kaplan–Meier estimate is calculated. This estimate is then fit to a Weibull distribution, yielding the analytically determined means and standard deviations. The resulting different bins are then treated as data points with errors in both axes and are fit by a particular model by employing the ODR method.
Current usage metrics show cumulative count of Article Views (full-text article views including HTML views, PDF and ePub downloads, according to the available data) and Abstracts Views on Vision4Press platform.
Data correspond to usage on the plateform after 2015. The current usage metrics is available 48-96 hours after online publication and is updated daily on week days.
Initial download of the metrics may take a while.