Fig. 2.
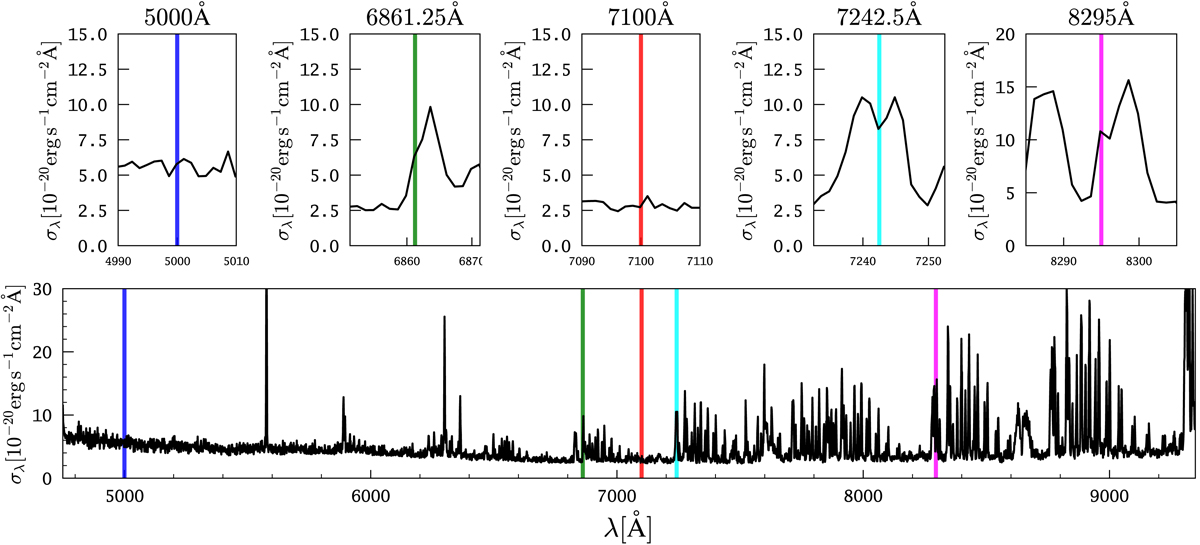
Insertion wavelengths for completeness function estimation. Bottom panel: the background noise over the whole spectral range; the vertical lines indicate the positions of the artificially implanted LAEs. Top panel: zoomed-in versions around the regions of interest. The colours of the vertical lines correspond to the colours used for the source recovery fractions in Figs. 3–5.
Current usage metrics show cumulative count of Article Views (full-text article views including HTML views, PDF and ePub downloads, according to the available data) and Abstracts Views on Vision4Press platform.
Data correspond to usage on the plateform after 2015. The current usage metrics is available 48-96 hours after online publication and is updated daily on week days.
Initial download of the metrics may take a while.