Free Access
Fig. 1.
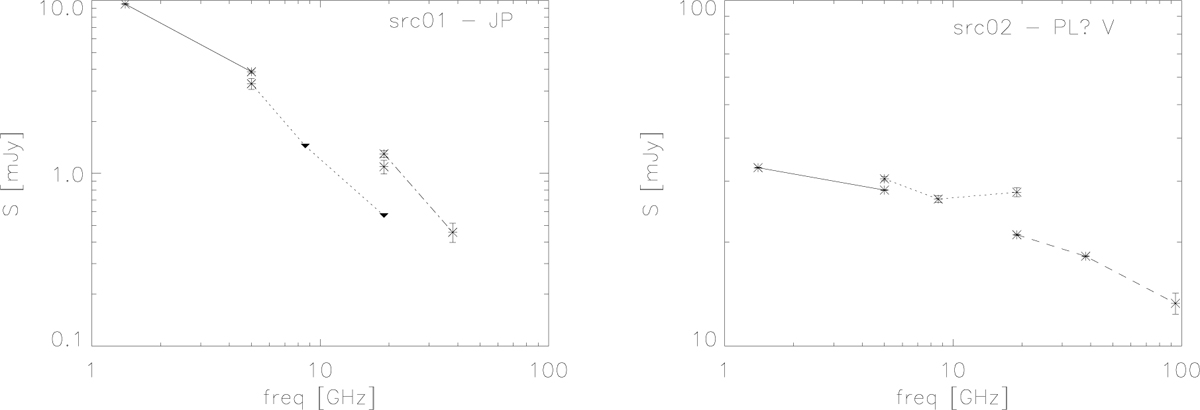
ATESP sample radio spectra. Asterisks are detections, (with error bars) downward triangles are upper limits, solid lines join ATESP survey points, dotted lines join 2007–2008 follow-up points, dashed lines join 2011 follow-up points, and dot-dashed lines join 2012 follow-up points.
Current usage metrics show cumulative count of Article Views (full-text article views including HTML views, PDF and ePub downloads, according to the available data) and Abstracts Views on Vision4Press platform.
Data correspond to usage on the plateform after 2015. The current usage metrics is available 48-96 hours after online publication and is updated daily on week days.
Initial download of the metrics may take a while.