Fig. 2.
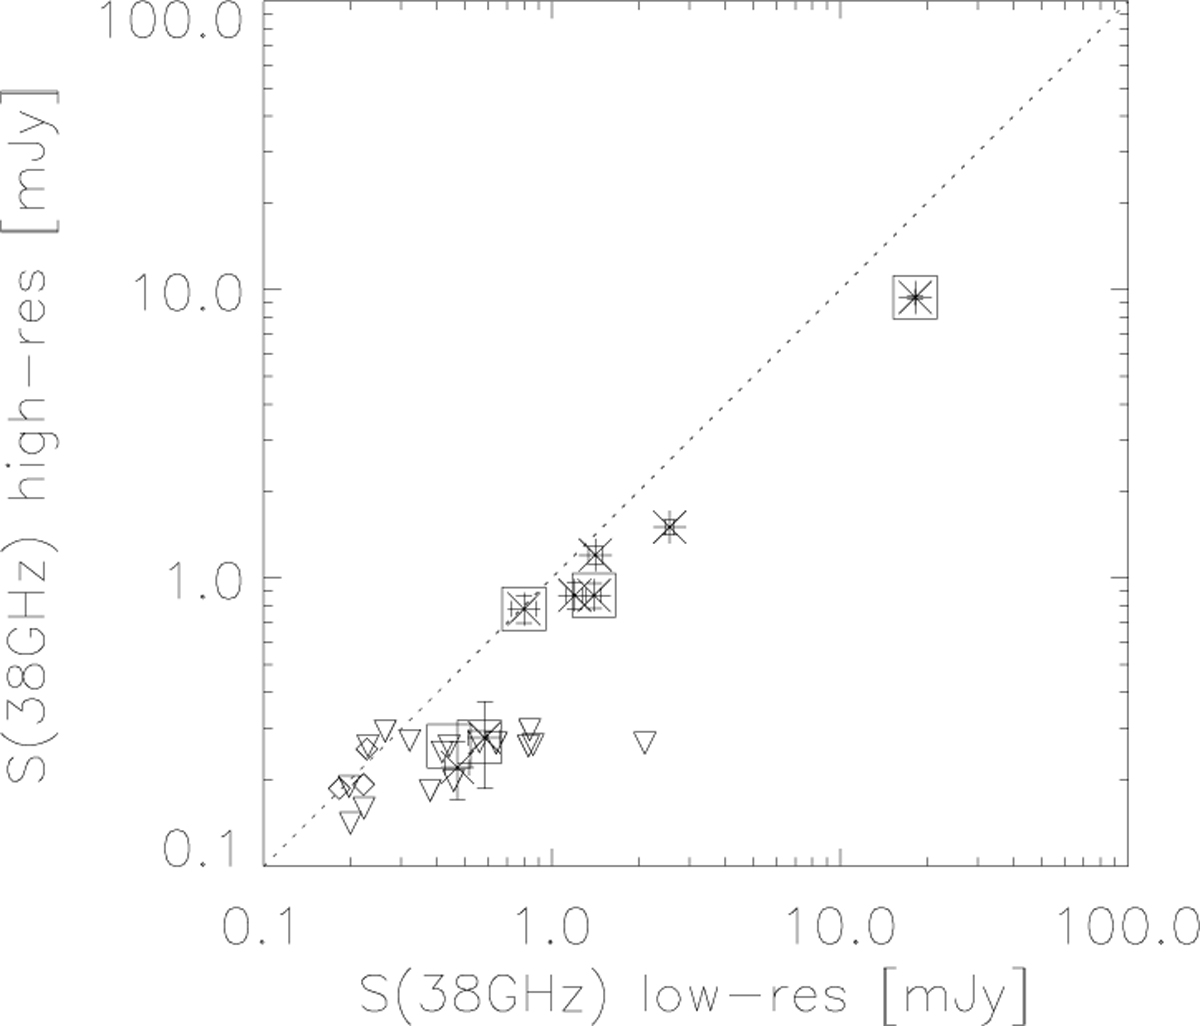
High- vs. low-resolution 38-GHz flux density. Asterisks with error bars are detections at both high and low resolution. Downward triangles show sources with 38-GHz high-resolution upper limits and low-resolution detections. Diamonds are upper limits at both resolutions. Sources tagged as variable are also indicated by squares.
Current usage metrics show cumulative count of Article Views (full-text article views including HTML views, PDF and ePub downloads, according to the available data) and Abstracts Views on Vision4Press platform.
Data correspond to usage on the plateform after 2015. The current usage metrics is available 48-96 hours after online publication and is updated daily on week days.
Initial download of the metrics may take a while.