Free Access
Fig. 6.
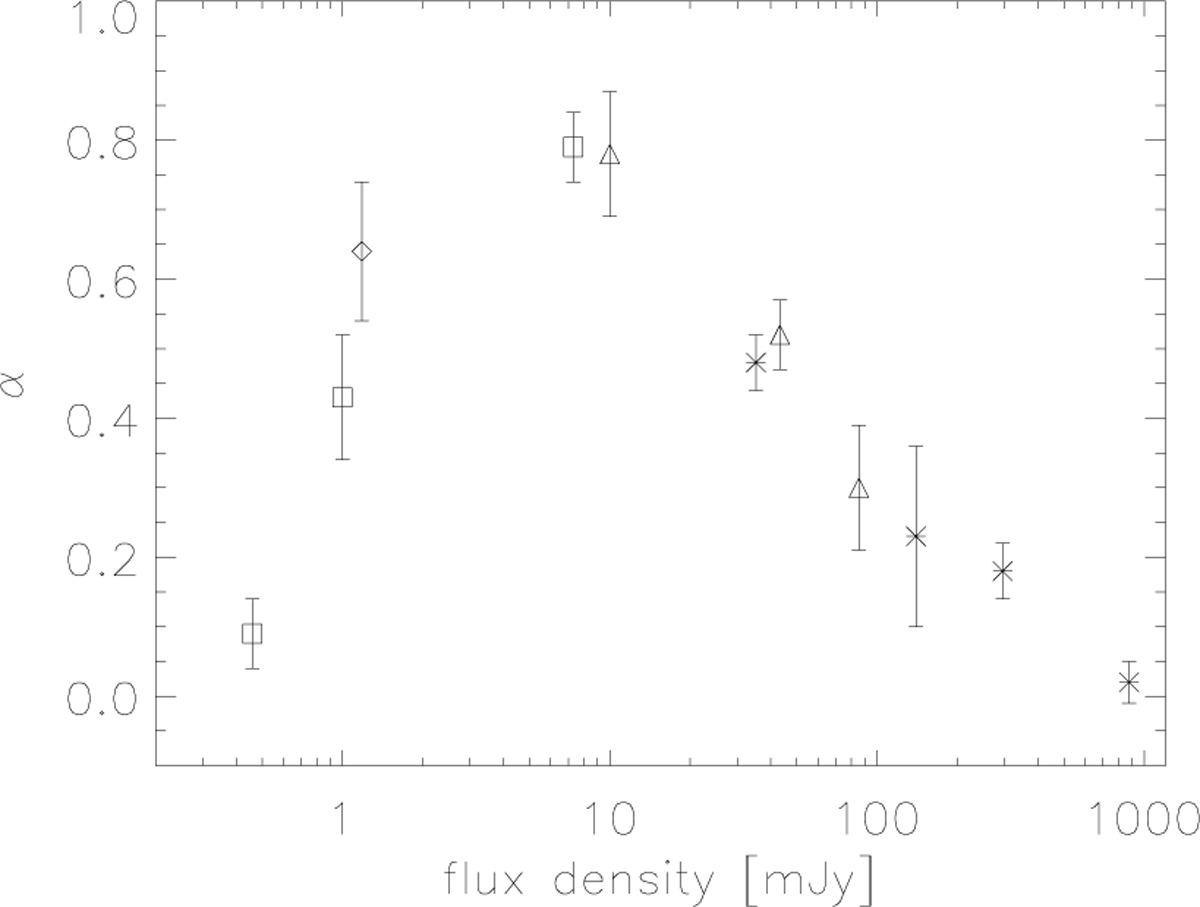
Median spectral index as a function of flux density from the ATESP sample (![]() , diamond), Bolton et al. (2004) sample (
, diamond), Bolton et al. (2004) sample (![]() ), the Bright (Massardi et al. 2011) and Faint (Bonavera et al. 2011) PACO samples (
), the Bright (Massardi et al. 2011) and Faint (Bonavera et al. 2011) PACO samples (![]() , asterisks). The 9C (triangles) and 10C (squares) survey points (
, asterisks). The 9C (triangles) and 10C (squares) survey points (![]() ) in Whittam et al. (2013) are also shown for comparison.
) in Whittam et al. (2013) are also shown for comparison.
Current usage metrics show cumulative count of Article Views (full-text article views including HTML views, PDF and ePub downloads, according to the available data) and Abstracts Views on Vision4Press platform.
Data correspond to usage on the plateform after 2015. The current usage metrics is available 48-96 hours after online publication and is updated daily on week days.
Initial download of the metrics may take a while.