Fig. 7.
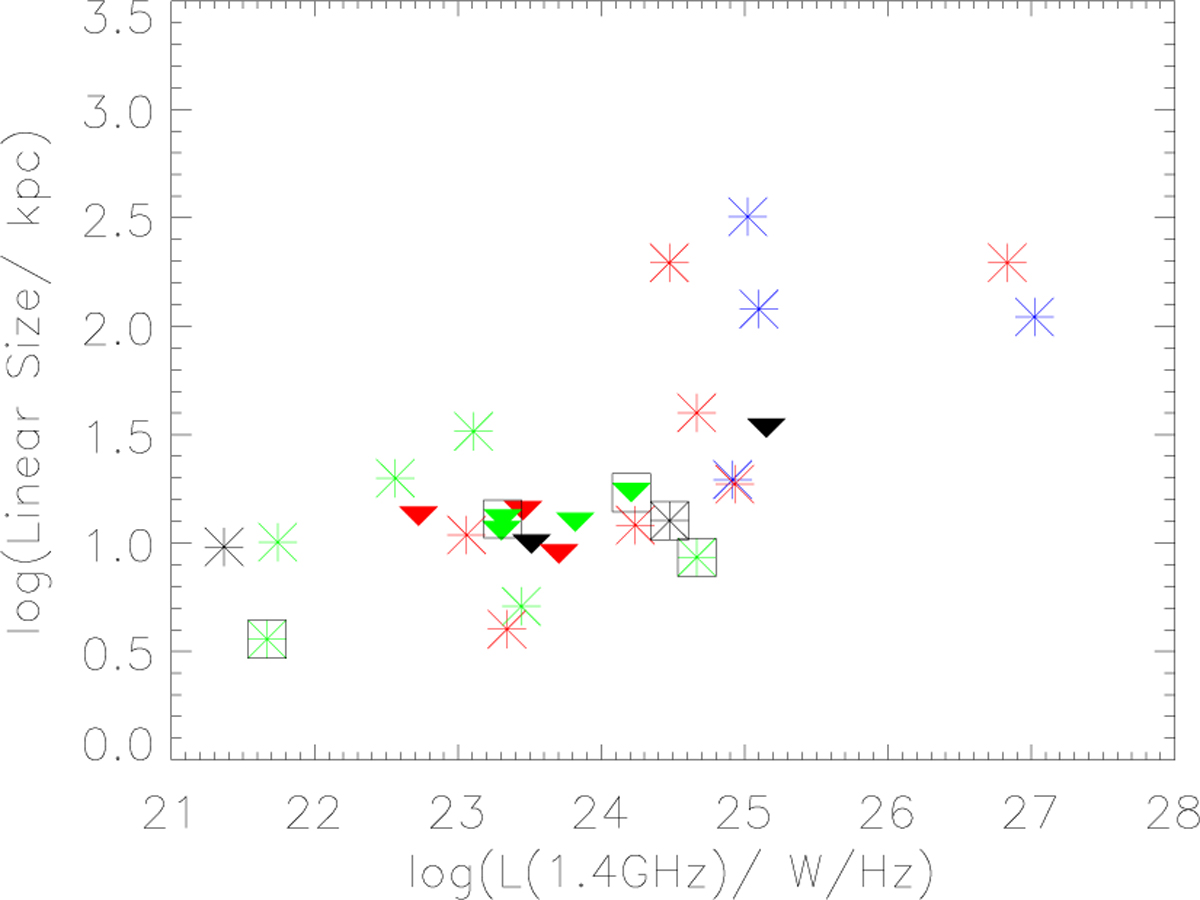
Rest-frame 1.4 GHz luminosity vs. linear size for the ATESP early-type galaxy sample. Asterisks represent sources with resolved sizes, while downward triangles represent upper limits. The quality of the model fit is colour-coded: blue for JP fits, red for power-law fits, black for uncertain fits (all PL marked with a question mark in Table 4) and green for sources that did not permit fitting. The 5 reliably variable sources are inside squares.
Current usage metrics show cumulative count of Article Views (full-text article views including HTML views, PDF and ePub downloads, according to the available data) and Abstracts Views on Vision4Press platform.
Data correspond to usage on the plateform after 2015. The current usage metrics is available 48-96 hours after online publication and is updated daily on week days.
Initial download of the metrics may take a while.