Fig. 6
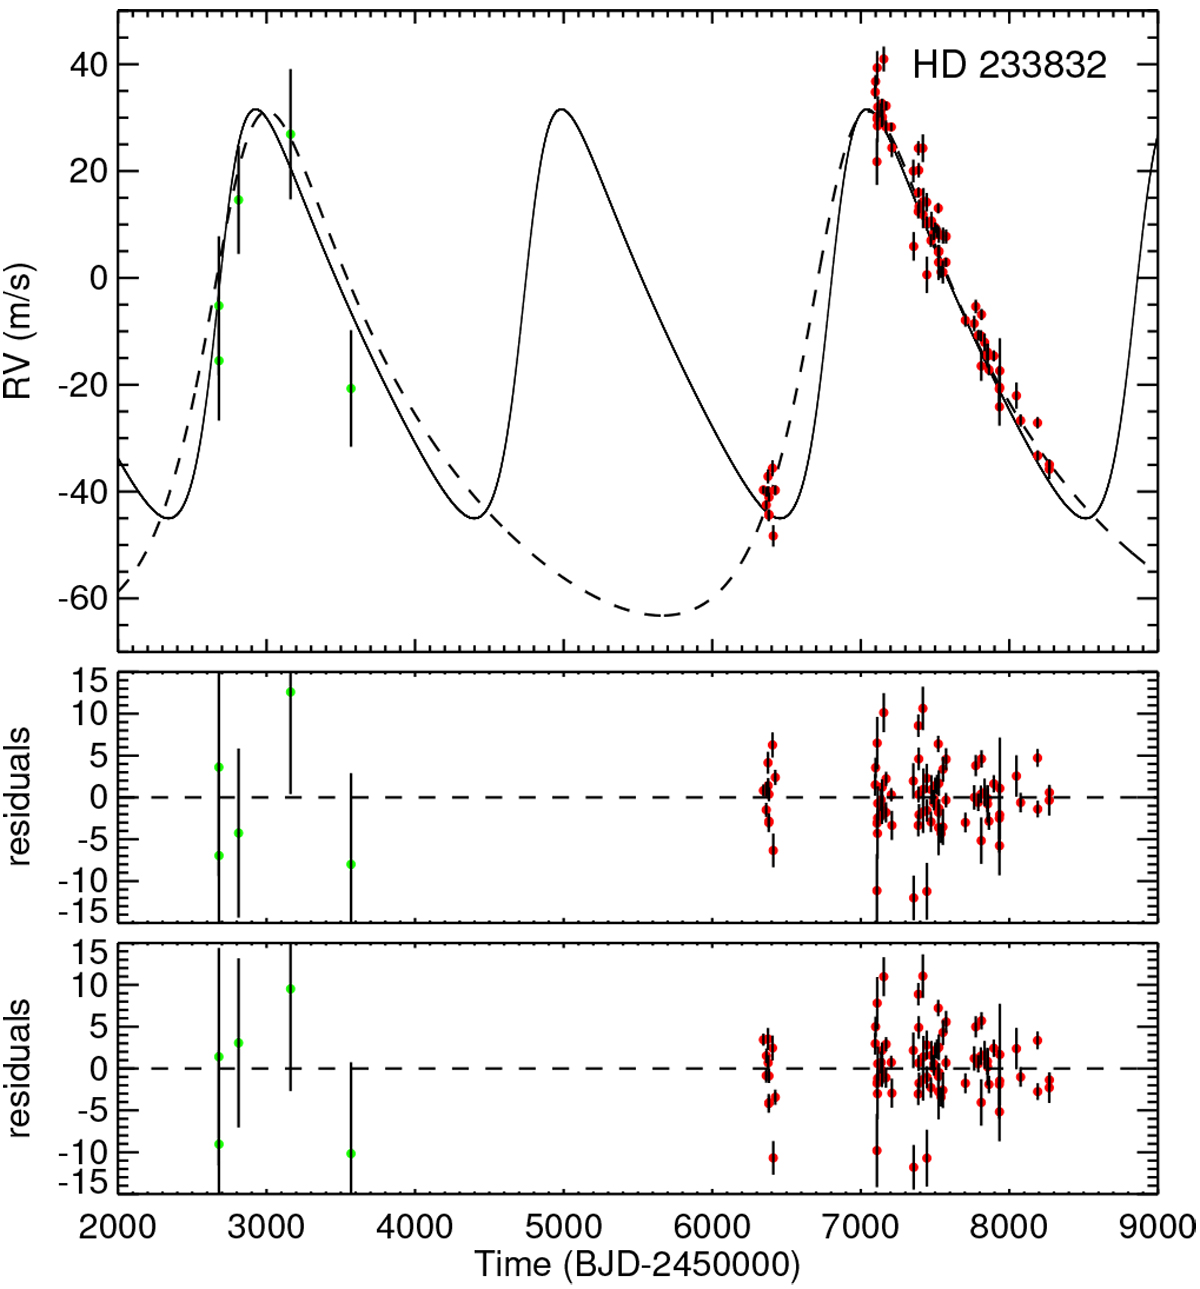
Same as Fig. 4, but for the planet HD 233832 b. Literature Keck datapoints are shown in green and our HARPS-N data are plotted in red. Top panel: solid black curve shows the solution obtained setting a prior on orbital period centred on 2000 days, while the dashed curve is derived from an orbital prior centred around 4000 days. Middle and bottom panels: residuals from the 2000-day and 4000-day solutions, respectively.
Current usage metrics show cumulative count of Article Views (full-text article views including HTML views, PDF and ePub downloads, according to the available data) and Abstracts Views on Vision4Press platform.
Data correspond to usage on the plateform after 2015. The current usage metrics is available 48-96 hours after online publication and is updated daily on week days.
Initial download of the metrics may take a while.