Free Access
Fig. C.3
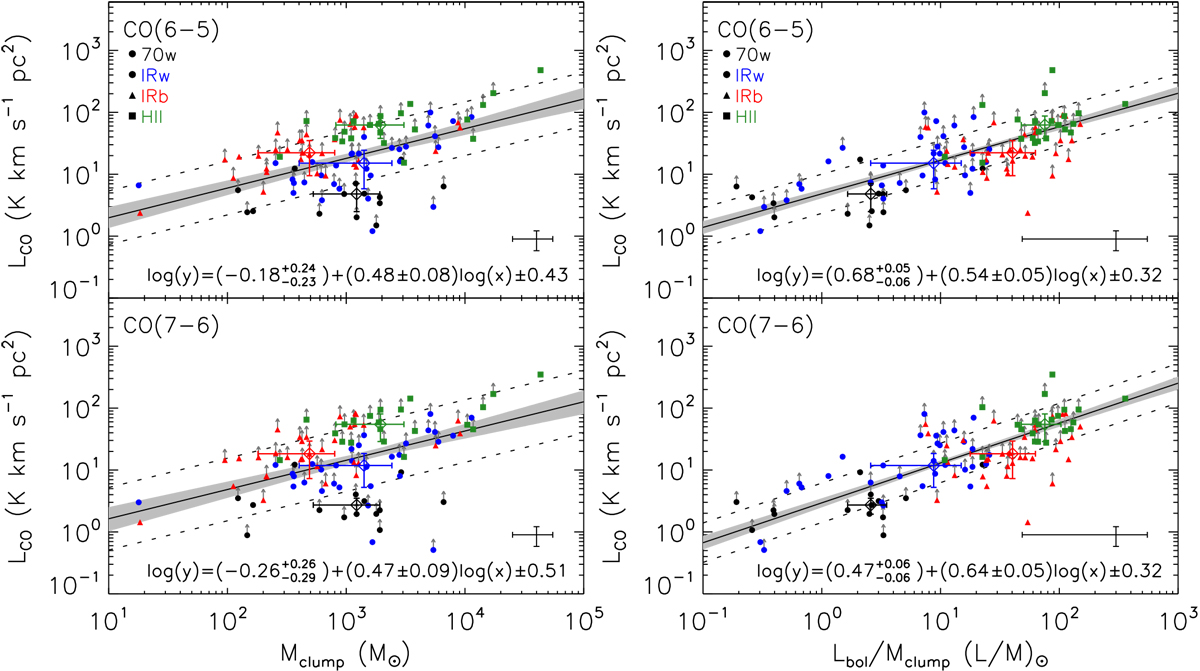
The CO line luminosity derived using the spectra convolved to the same linear scale of 0.24 pc are shown versus their masses(left panels) and their luminosity-to-mass ratios (right panels). For a complete description of the plots, see Fig. C.2.
Current usage metrics show cumulative count of Article Views (full-text article views including HTML views, PDF and ePub downloads, according to the available data) and Abstracts Views on Vision4Press platform.
Data correspond to usage on the plateform after 2015. The current usage metrics is available 48-96 hours after online publication and is updated daily on week days.
Initial download of the metrics may take a while.