Fig. 7

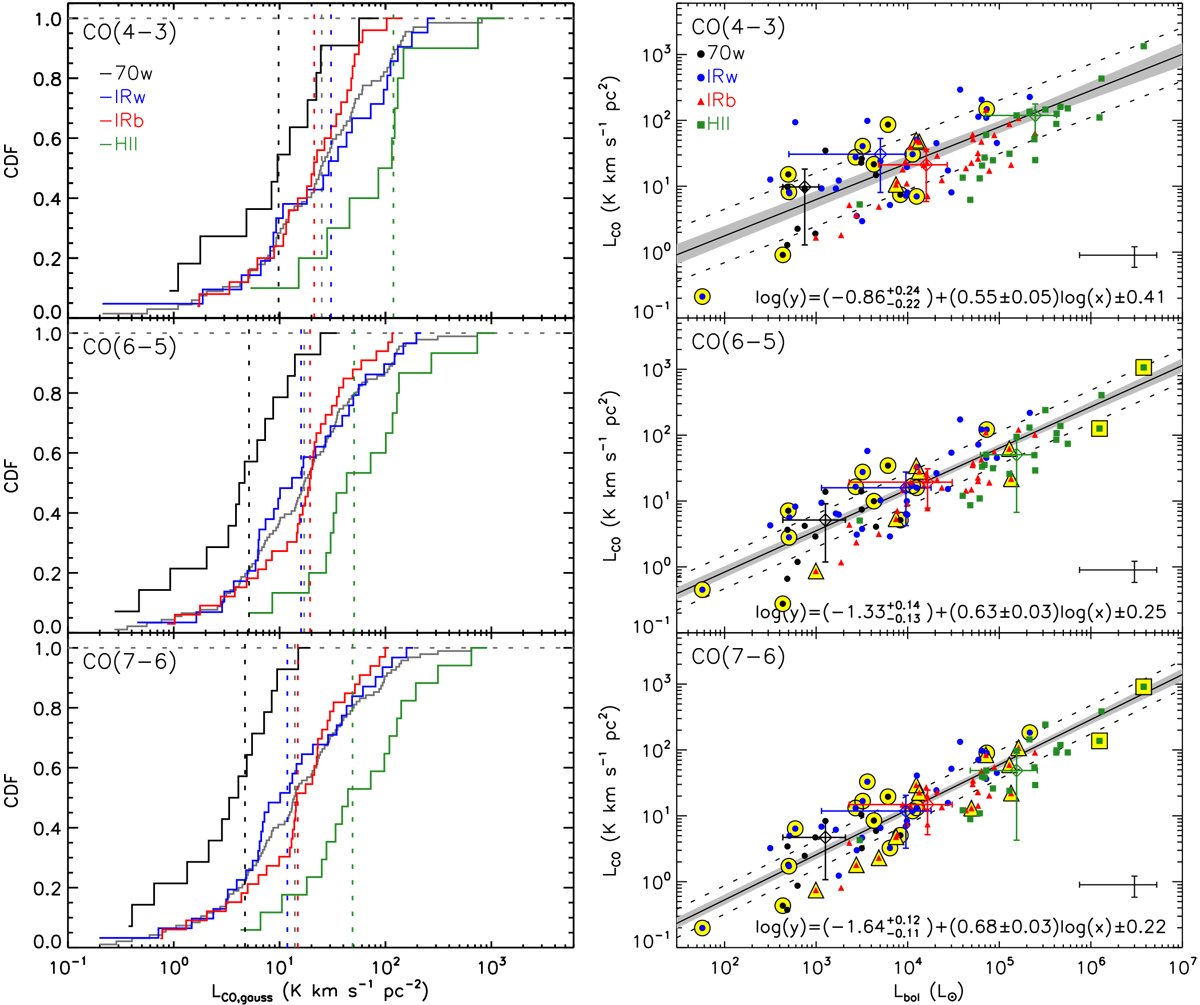
Left panels: cumulative distribution function of the line luminosity of the CO (4–3) (upper panel), CO (6–5) (middle panel) and CO (7–6) emission (bottom panel) towards the TOP100 sample. The median values per class are shown as vertical dashed lines in their corresponding colours. Right panels: Line luminosity of the same CO J-transitions versus the bolometric luminosity of the TOP100 sources. The median values for each class are shown as open diamonds and their error bars correspond to the absolute deviation of the data from their median value. Data points highlighted in yellow indicate those sources from which no signs of self-absorption features where identified in the spectrum convolved to 13.′′ 4. The typical error bars are shown at the bottom right side of the plots. The black solid line is the best fit, the light grey shaded area indicates the 68% uncertainty, and the dashed lines show the intrinsic scatter (ϵ) of the relation.
Current usage metrics show cumulative count of Article Views (full-text article views including HTML views, PDF and ePub downloads, according to the available data) and Abstracts Views on Vision4Press platform.
Data correspond to usage on the plateform after 2015. The current usage metrics is available 48-96 hours after online publication and is updated daily on week days.
Initial download of the metrics may take a while.


