Fig. 2
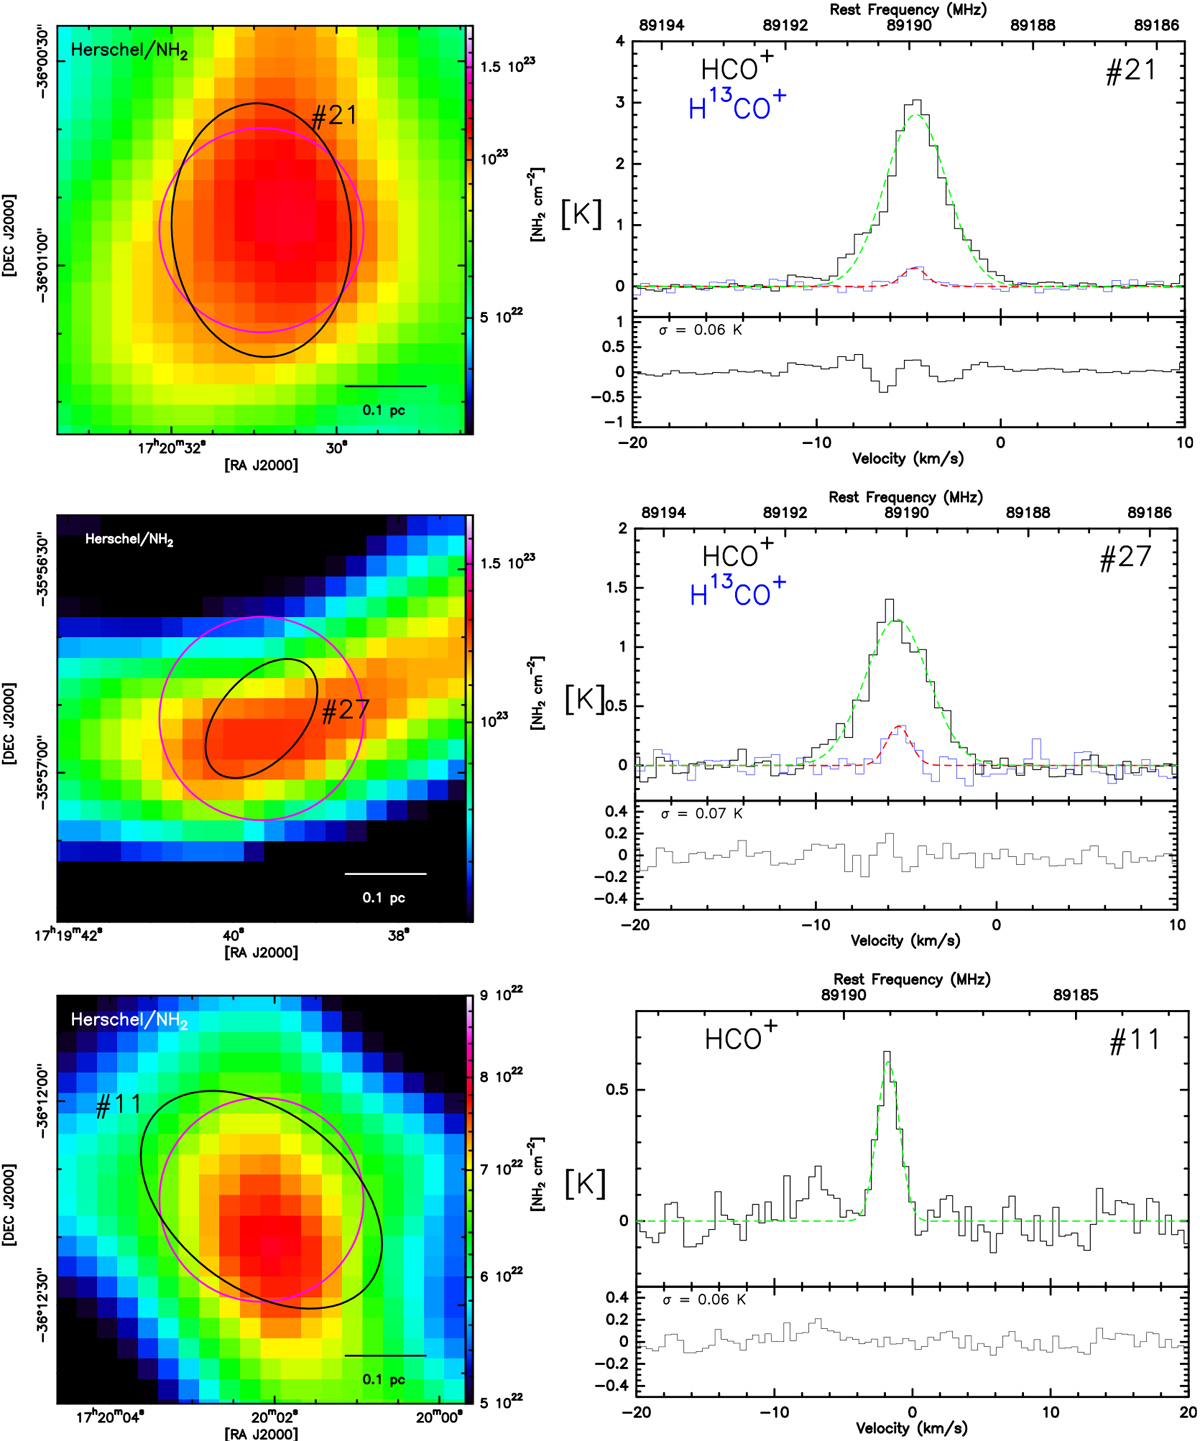
Left panel: Herschel column density maps toward the nine MDCs studied here. The black ellipse indicates the position and size of the MDC as extracted by Tigé et al. (2017), and the magenta circle shows the beam of the MOPRA telescope. Right panel: HCO+ (1–0) and H13 CO+(1–0) (or N2 H+, see the label in the panels) emission lines toward the MDCs as seen with MOPRA. The lines are adjusted by a Gaussian (or with the hfs procedure in CLASS to fit the multiplet of the N2 H+) whose results are presented in Table 1. The frame on the bottom displays the residuals of the HCO+ (1–0) emission after subtraction of the Gaussian feature shown on the top frame.
Current usage metrics show cumulative count of Article Views (full-text article views including HTML views, PDF and ePub downloads, according to the available data) and Abstracts Views on Vision4Press platform.
Data correspond to usage on the plateform after 2015. The current usage metrics is available 48-96 hours after online publication and is updated daily on week days.
Initial download of the metrics may take a while.