Fig. 6
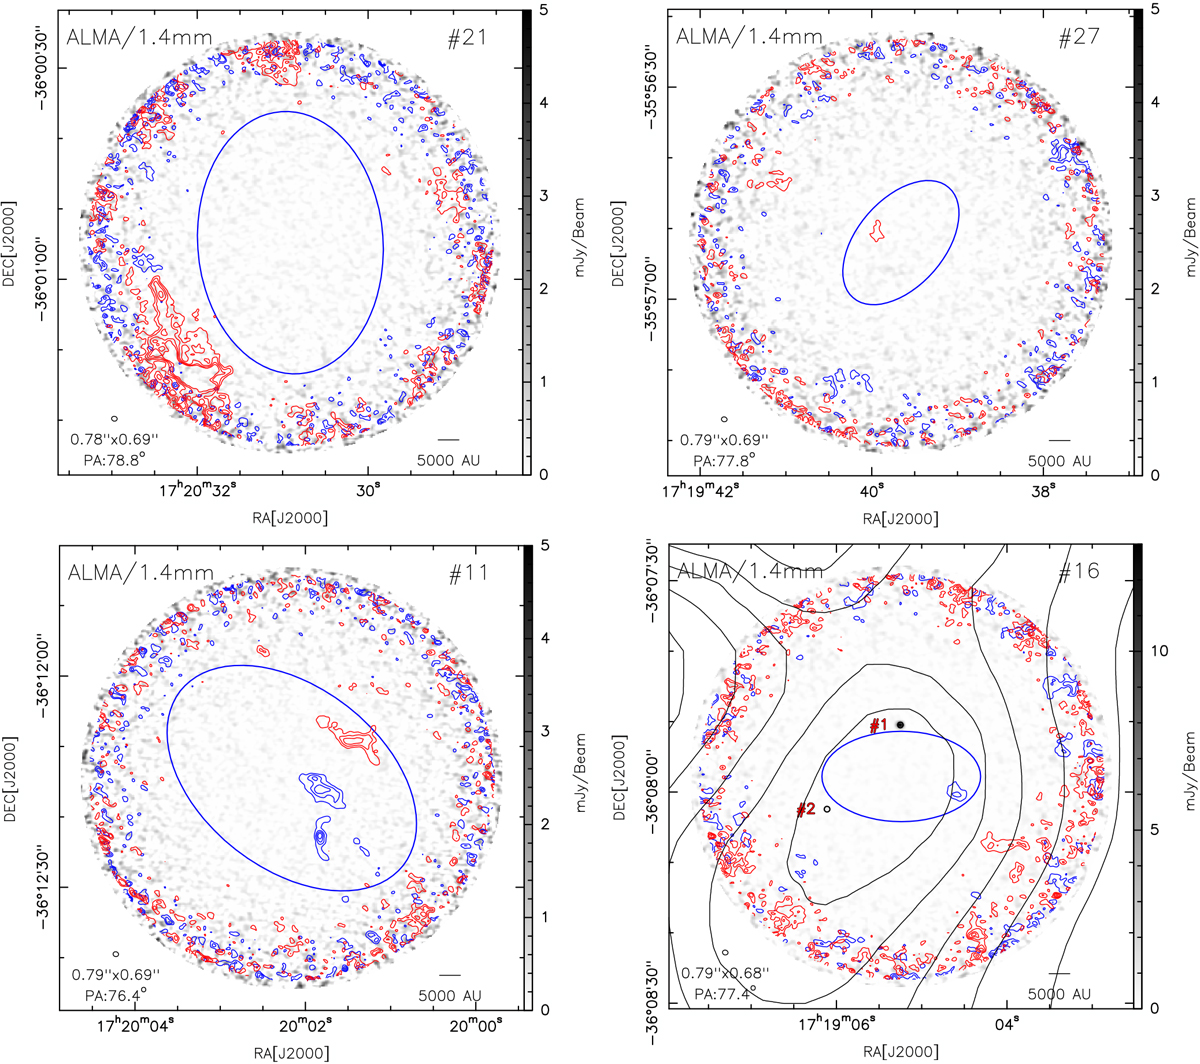
ALMA 1.4 mm continuum emission toward the nine MDCs. The blue ellipses show the MDCs as defined by Tigé et al. (2017). The compact sources extracted by Getsources in the MDCs #16, #26, and #45 (see text and Table 2 for details) are indicated with small black ellipses and red labels. The blue and red contours highlight the ALMA 12CO(2–1) integrated emission in the blueshifted and redshifted channels, respectively. The contours start at 3σ with a 3σ step in each panel. The values for the integration in velocities and the resulting rms is given in Table A.2. Bottom right panel: black contours (MDC #16) show the column density emission derived from Herschel observations (Tigé et al. 2017). The contours range from 50 to 90% by step of 10% of the peak flux in the MDC #16 (blue ellipse). They show that the continuum sources ALMA#1 and #2 are associated with the MDC #16.
Current usage metrics show cumulative count of Article Views (full-text article views including HTML views, PDF and ePub downloads, according to the available data) and Abstracts Views on Vision4Press platform.
Data correspond to usage on the plateform after 2015. The current usage metrics is available 48-96 hours after online publication and is updated daily on week days.
Initial download of the metrics may take a while.