Fig. 7
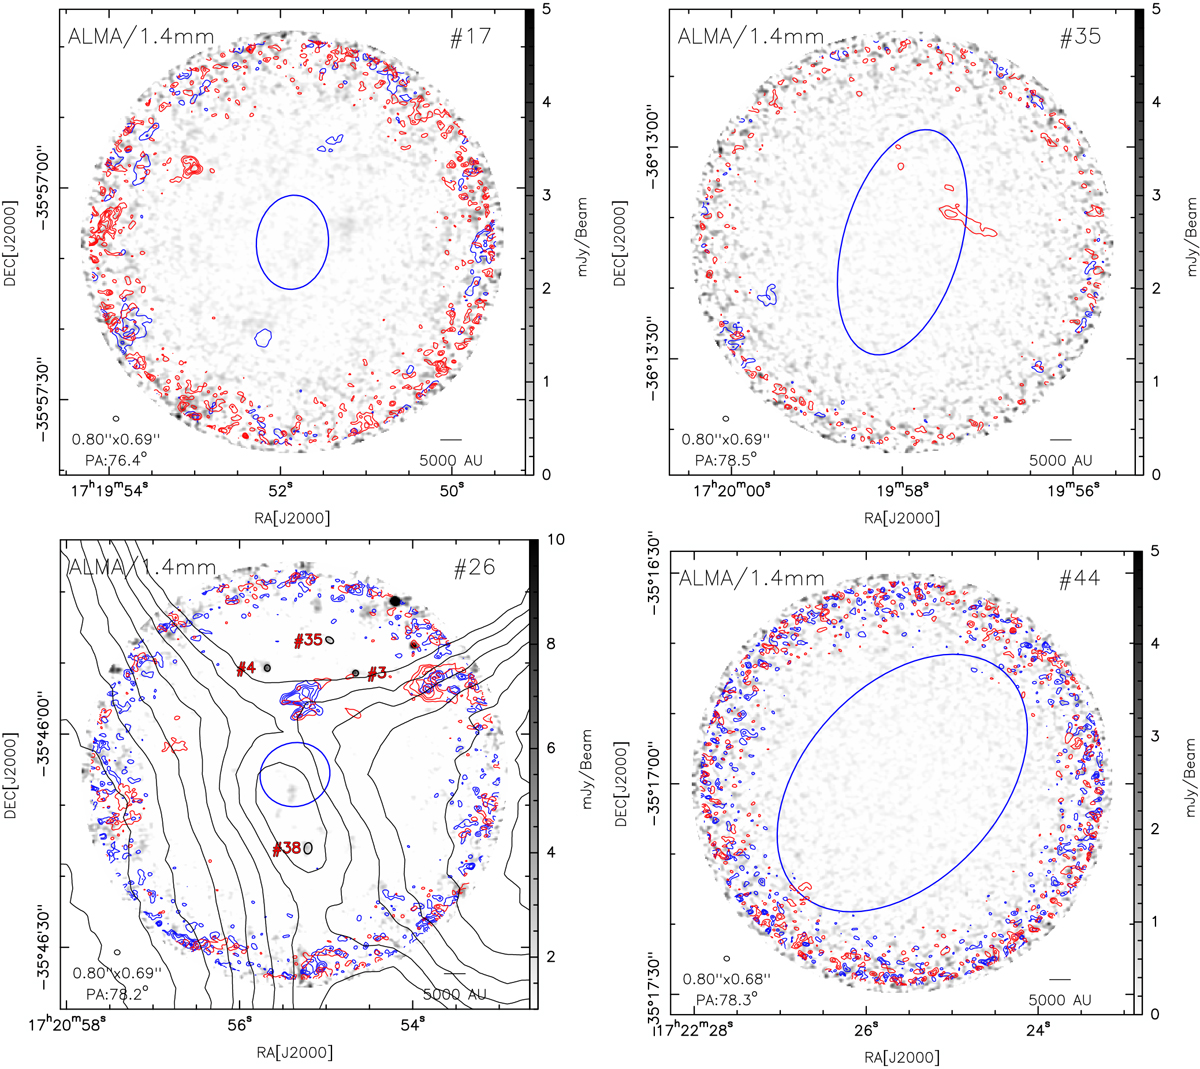
Following Fig. 6. Bottom left panel: black contours show the JCMT/SCUBA-2/450 μm emission presented in Tigé et al. (2017). The contours range from 20 to 90% of the peak flux inside the MDC #26 (defined by the blue ellipse) by step of 10%. They show that the continuum source ALMA#38 is associated with the MDC #26, while the continuum sources ALMA#3, #4, and #35 belong to another structure.
Current usage metrics show cumulative count of Article Views (full-text article views including HTML views, PDF and ePub downloads, according to the available data) and Abstracts Views on Vision4Press platform.
Data correspond to usage on the plateform after 2015. The current usage metrics is available 48-96 hours after online publication and is updated daily on week days.
Initial download of the metrics may take a while.