Fig. 2.
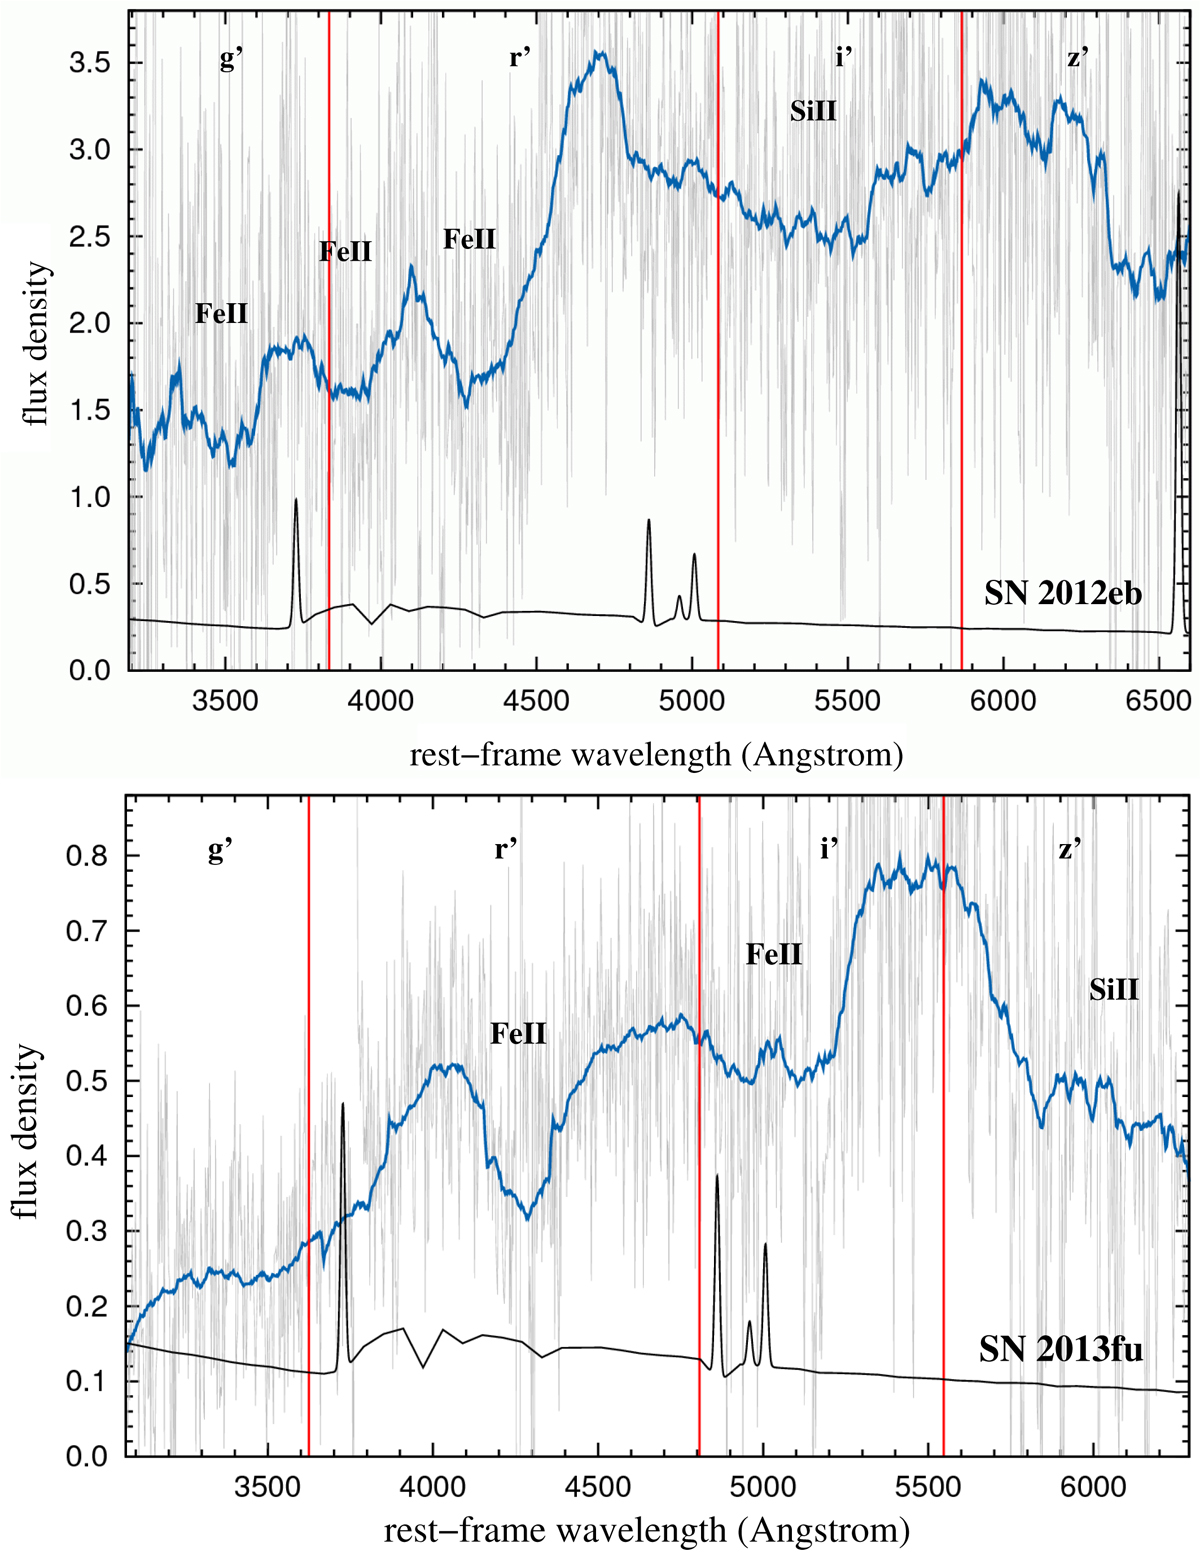
FORS2 spectra of SN 2012eb and SN 2013fu (plus underlying host-galaxy emission). These spectra are not host-galaxy subtracted, since no spectra of the hosts could be taken. In gray is shown the original spectrum and in blue the spectrum smoothed with a boxcar filter of 250 Å in width. The spectra are shifted into the GRB rest frames but the flux density (in units of 10−18 erg s−1 cm−2 Å−1) is measured in the observer frame. Also drawn are the positions and widths of the GROND filter bands in the GRB rest frame. We note that in the case of the g′ and the z′ bands the (redshifted) filter width is slightly larger than shown here (Greiner et al. 2007, 2008). Top panel: SN 2012eb, taken on day 18.3 post-burst (observer frame), about 2 days (rest frame) after the SN maximum in the r′ band (Klose et al. 2012a,b). Bottom panel: SN 2013fu, obtained at a mean time of t = 29 days post-burst (observer frame), about 6 days (rest frame) after the SN maximum in the r′i′z′ bands (Klose et al. 2013a,b). Also shown are the host-galaxy template SEDs (black lines; Appendices A.3, A.4) mainly to illustrate where emission lines from the hosts might exist. We note that the predicted (modeled) flux in the emission lines has a substantial error, which is not shown here; see text.
Current usage metrics show cumulative count of Article Views (full-text article views including HTML views, PDF and ePub downloads, according to the available data) and Abstracts Views on Vision4Press platform.
Data correspond to usage on the plateform after 2015. The current usage metrics is available 48-96 hours after online publication and is updated daily on week days.
Initial download of the metrics may take a while.