Fig. 2.
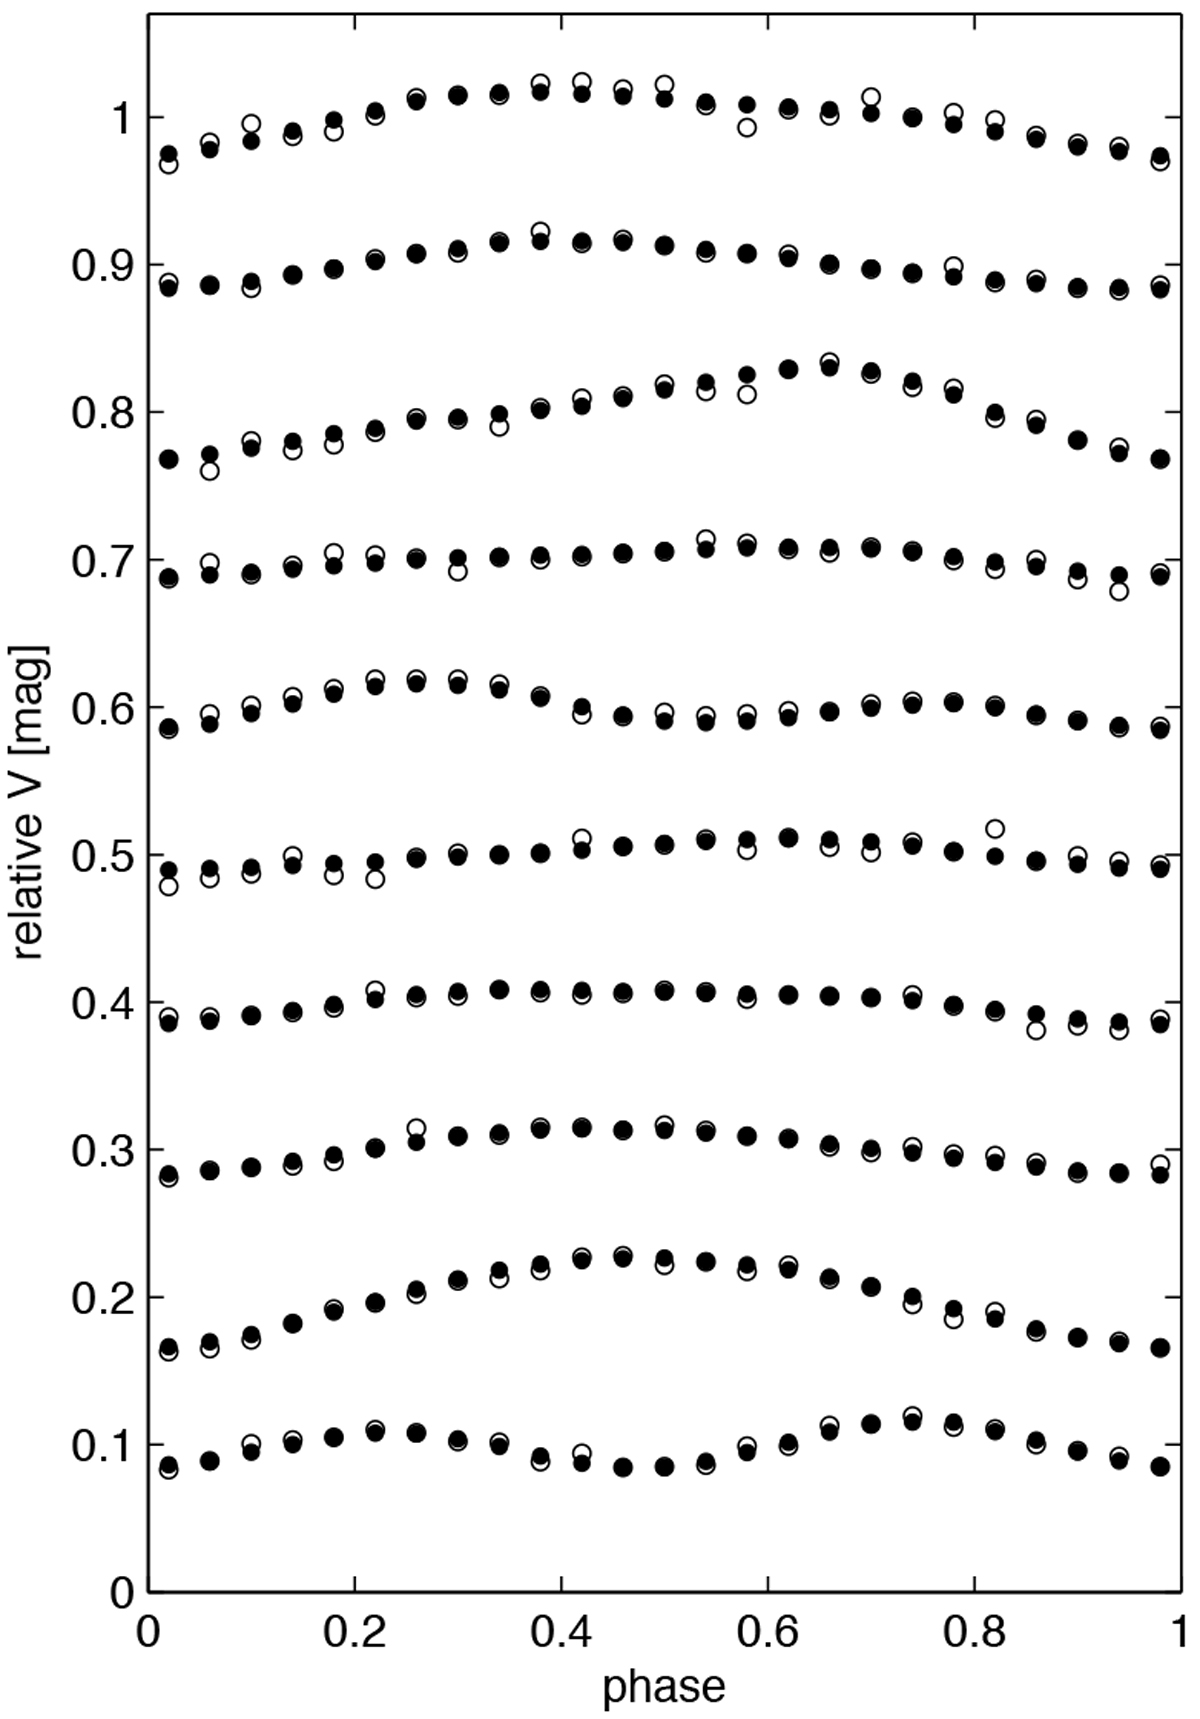
Binned light curves of the first ten stars of our sample. The open circles represent averages of real measurements in a particular bin. The filled circles indicate the fit obtained as a linear combination of the first three principal components. The y-axis describes the relative changes in V flux for eachlight curve. The light curves for different stars have been vertically shifted for clarity.
Current usage metrics show cumulative count of Article Views (full-text article views including HTML views, PDF and ePub downloads, according to the available data) and Abstracts Views on Vision4Press platform.
Data correspond to usage on the plateform after 2015. The current usage metrics is available 48-96 hours after online publication and is updated daily on week days.
Initial download of the metrics may take a while.