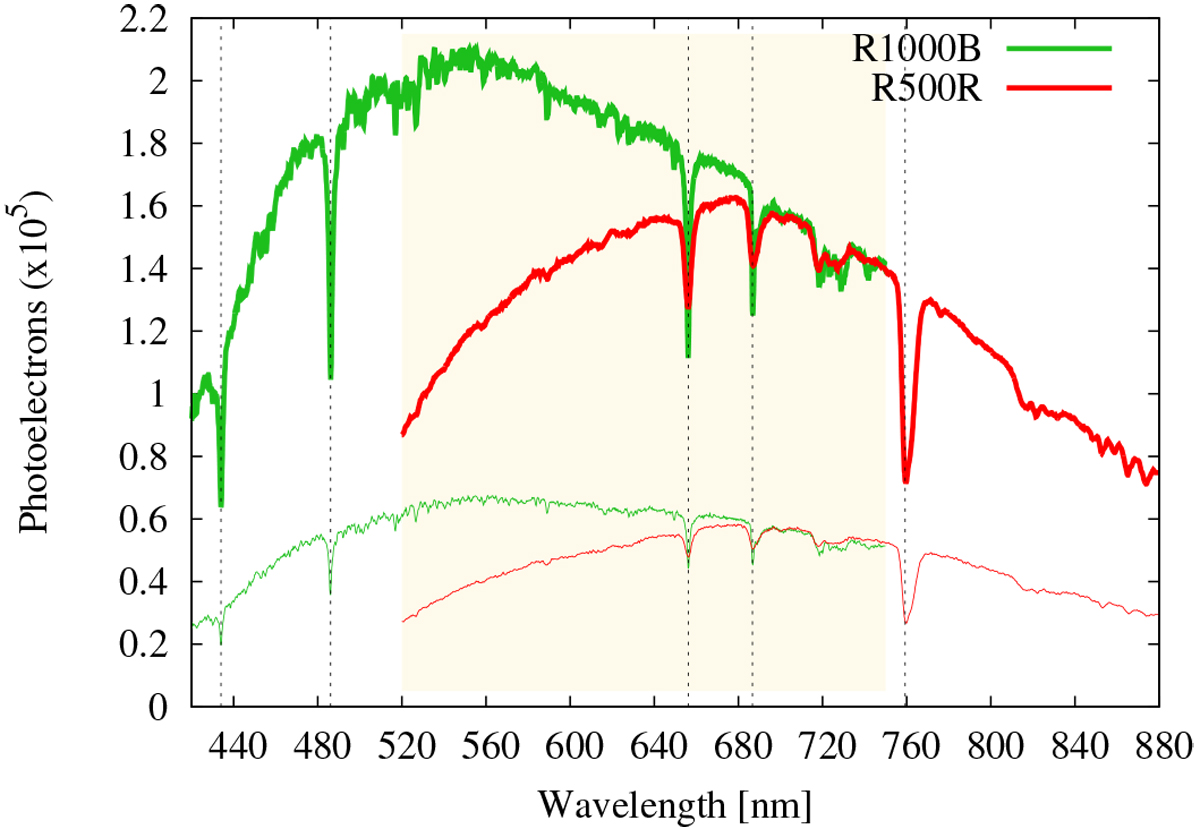
Fig. 1

Extracted spectra in photoelectrons for WASP-33 (continuous thick lines) and BD+36 488 (continuous thin lines) for the R1000B and R500R grisms (green and red colors, respectively). Vertical dashed black lines indicate the atmospheric and stellar lines used to align the spectra. The yellow shaded region highlights the wavelength coverage of the data sets used to construct the white light curves (see Sect. 3.1).
Current usage metrics show cumulative count of Article Views (full-text article views including HTML views, PDF and ePub downloads, according to the available data) and Abstracts Views on Vision4Press platform.
Data correspond to usage on the plateform after 2015. The current usage metrics is available 48-96 hours after online publication and is updated daily on week days.
Initial download of the metrics may take a while.


