Fig. 6
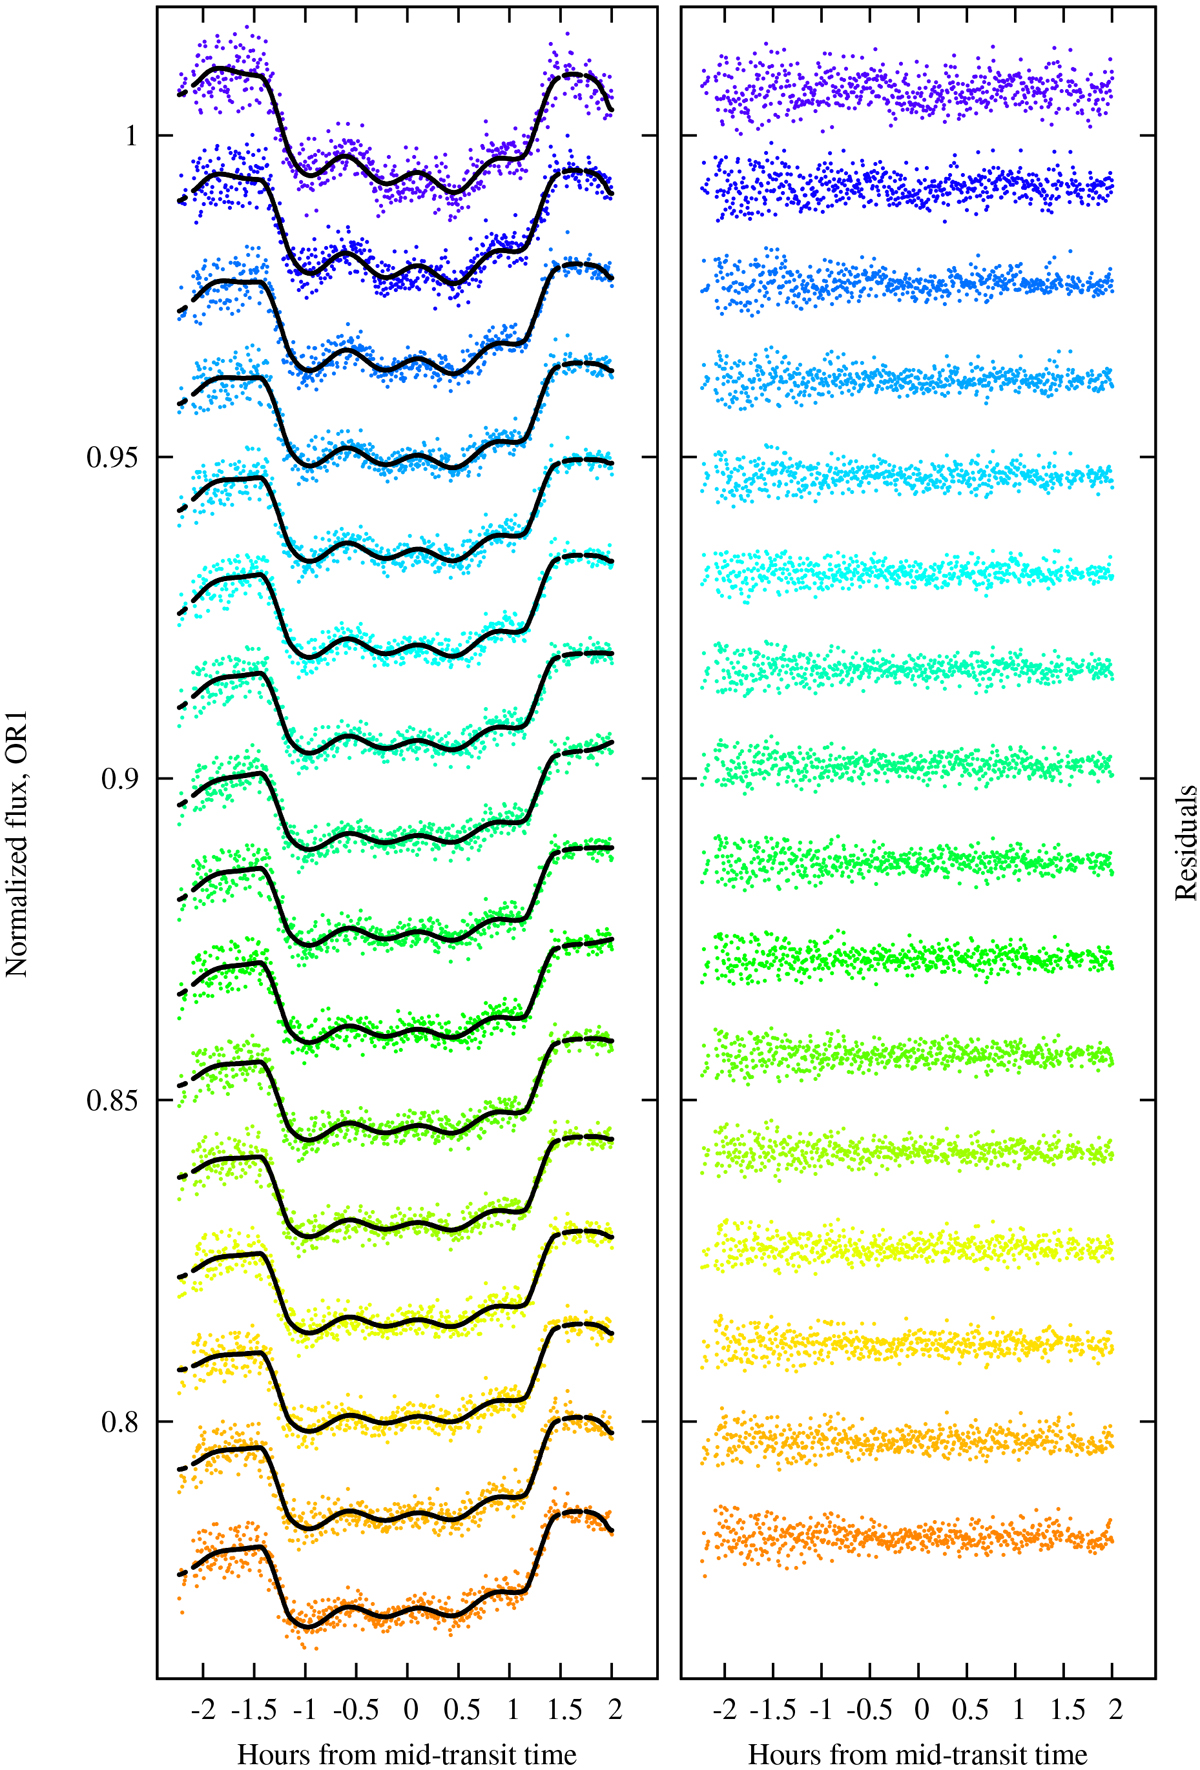
Our 16 chromatic transit light curves obtained during OR1 on the left panels, and corresponding residuals on the right panels.The continuous black line represents our model, comprising the pulsations, the detrending, and the transit models. Transits are plotted in hours from mid-transit time, and are shifted vertically to allow for visual inspection.
Current usage metrics show cumulative count of Article Views (full-text article views including HTML views, PDF and ePub downloads, according to the available data) and Abstracts Views on Vision4Press platform.
Data correspond to usage on the plateform after 2015. The current usage metrics is available 48-96 hours after online publication and is updated daily on week days.
Initial download of the metrics may take a while.